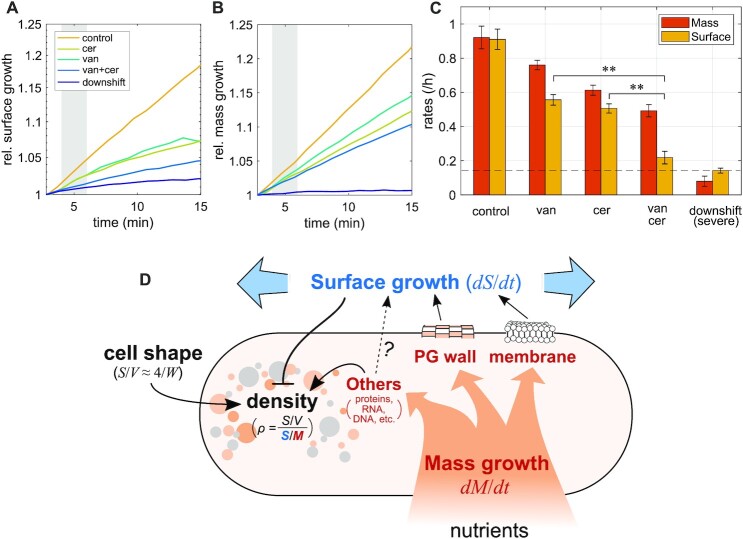
Fig. 5.
Simultaneous inhibition of multiple envelope-synthesis pathways. (A)–(C) Single-cell time lapse of wild-type cells on agarose pads (S750+GlcCaa) that contain drugs (50 μg/ml vancomycin; 100 μg/ml cerulenin; and 50 μg/ml vancomycin + 100 μg/ml cerulenin) or alpha-MG for a severe nutrient downshift (see Fig. 2C). Relative increase of surface area (A) and dry mass (B). (Normalized by respective values at time = 3 ± 1 min) (C) Average rates of surface growth and mass growth calculated from the shaded regions in (A) and (B) (at about 5 min; error bars = ± SE). Dashed line indicates the surface-growth rate during severe nutrient downshift. The surface-growth rate during double drug treatment is significantly slower than those during single drug treatments (P< 0.01). (D) Model of the relationship between physiology, surface growth, and mass density in B. subtilis: nutrient uptake leads to mass growth, including macromolecules (proteins, RNA, DNA, and so on), peptidoglycan cell wall, and cytoplasmic membrane. Peptidoglycan insertion, membrane insertion, and possibly other processes (notably, envelope protein insertion) are required for surface growth. Because the surface-to-mass ratio is maintained approximately constant during perturbations of growth rate and cell shape, surface growth is thought to be controlled by mass growth. Cytoplasmic mass density is determined by cytoplasmic mass growth, surface growth, and cell shape according to a simple formula that relates density to the robust surface-to-mass ratio and to the surface-to-volume ratio.

