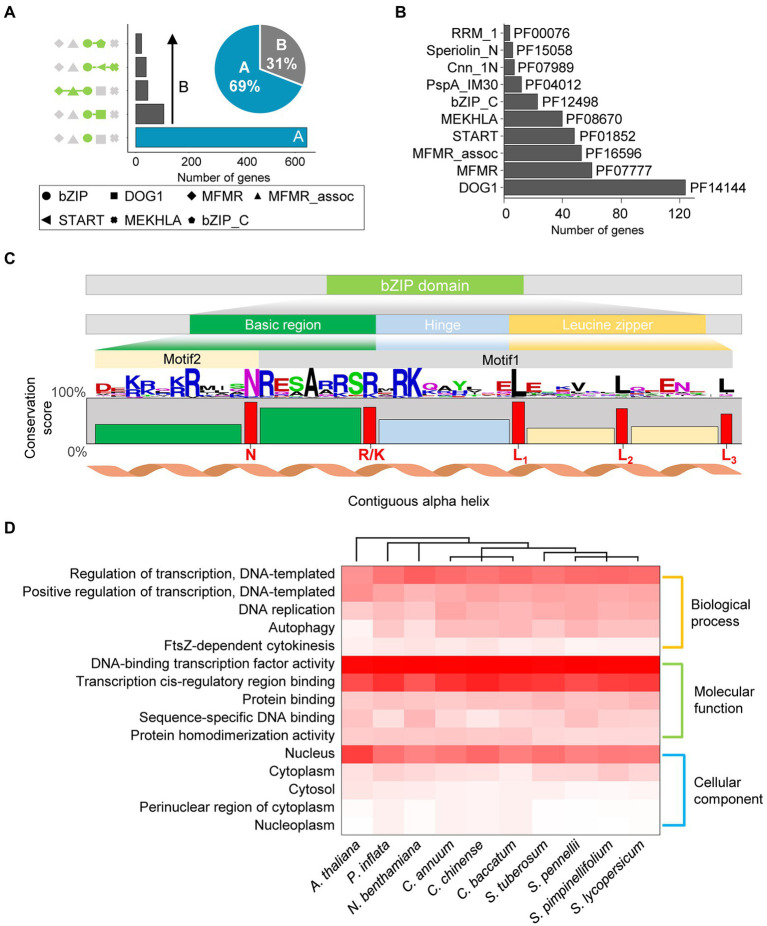
Figure 1.
Characteristics of bZIP genes in Solanaceae. (A) The number of genes with the top five domain architecture repertoires is illustrated in the bar chart. Different domain architectures are shown on the left of the chart; domains are defined by different shaped symbols as defined below the chart. The percentages of the two types of bZIP genes are presented in the pie chart. (B) The bar chart shows the number of genes with integrated domains (top 10). Pfam IDs of the integrated domains are labeled next to the chart. (C) The amino acid sequence of the bZIP domain in 10 species. The height of the amino acid residue indicates the relative frequency of each amino acid at the specific position. The conservation scores of each compartment and residues are displayed as bar plots. The bar colors represent three regions of the bZIP domain: green, basic region; light blue, hinge region; and yellow, leucine zipper region. Red letters below the bar plots represent significantly conserved residues in bZIP genes. (D) Distribution of gene ontology (GO) terms of bZIP genes. The three GO categories are displayed on the right side of the heat map. The top five GO descriptions in each category are shown in the heat map. The colored scale at the bottom right side of the heat map represents the proportion of bZIP genes in each species.

