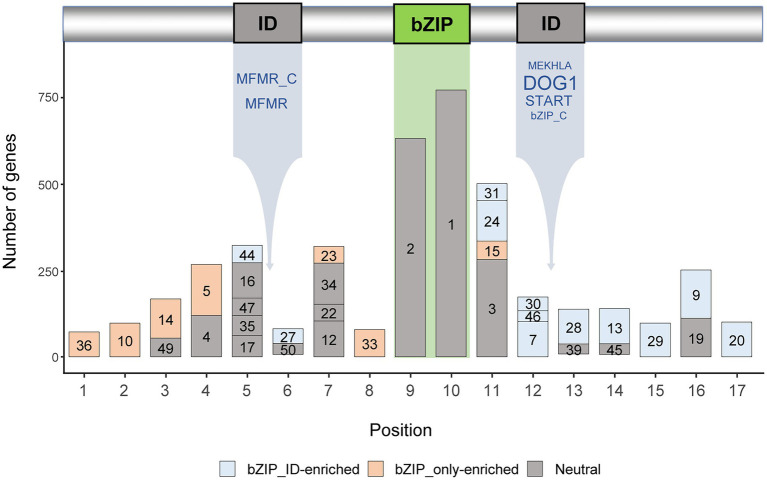
Figure 2.
Motif compositions of the top five domain architectures of bZIP genes. The numbers in the bars indicate motif labels as described in Supplementary Table 2. The types of integrated domains are listed below the ID box. The font sizes of the names of integrated domains represent the number of domains. Bar colors represent bZIP_only-enriched, bZIP_IDs-enriched, or neutral (p < 0.0001).

