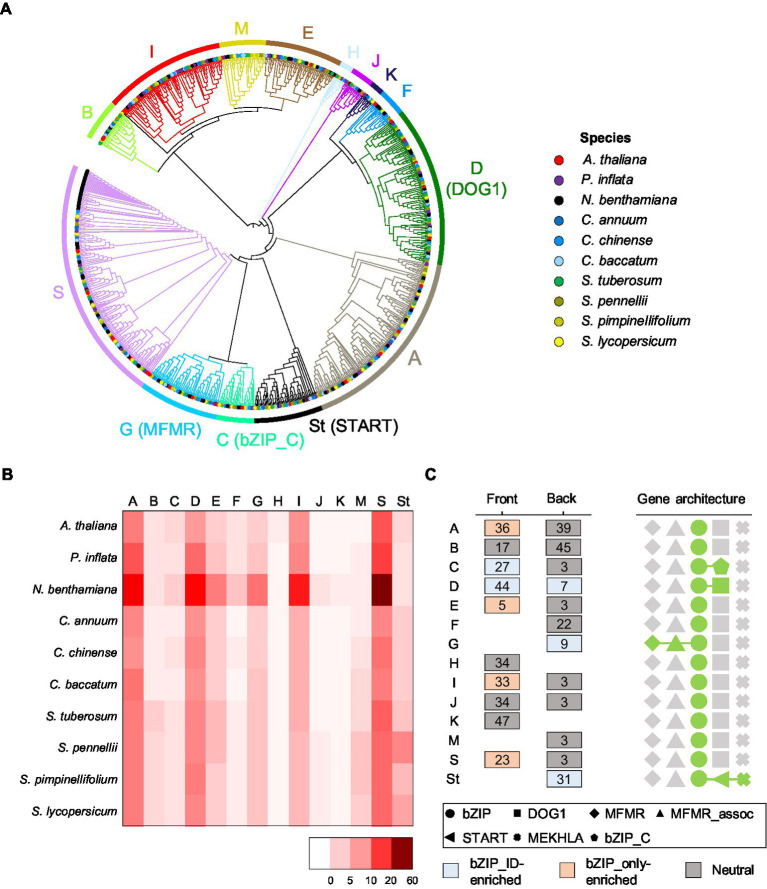
Figure 3.
Phylogenetic relationships among bZIP genes and subgroup characteristics. (A) Phylogenetic tree of bZIP genes in the 10 plant species. Different species on the end of the branch are denoted by different colors. The colored branch and colored bars on the outer ring represent individual subgroups. Subgroup names are listed next to the outer rings representing integrated domains in the bracket. (B) The numbers of bZIP genes in subgroups by species are shown in a heatmap. Scale bars on the bottom right side indicate the number of genes. (C) The most abundant motifs adjacent to the bZIP domain are portrayed. Numbers in boxes indicate motif labels. The box colors represent the type of enriched motifs. The top five domain architecture repertoires are shown on the right side as different geometric patterns.

