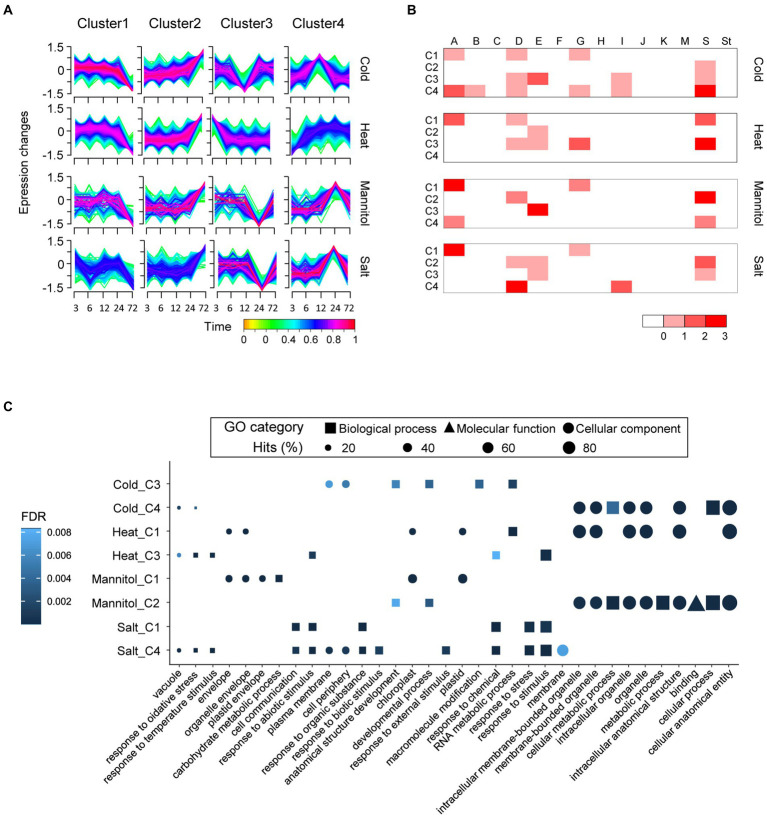
Figure 4.
Transcriptome and gene ontology (GO) enrichment analyses of differentially expressed genes under four abiotic treatments in pepper (Capsicum annuum). (A) Expression patterns of whole pepper DEGs and bZIP DEGs during abiotic stress are displayed as four clusters for each abiotic stress. (B) Heatmap depicts the number of bZIP DEGs in each subgroup. The scale colors on the bottom right side of the heat map display the number of genes. (C) The top five GO terms enriched in each major cluster are displayed in dot plots. Shapes represent the GO categories; shape sizes represent the GO term frequencies.

