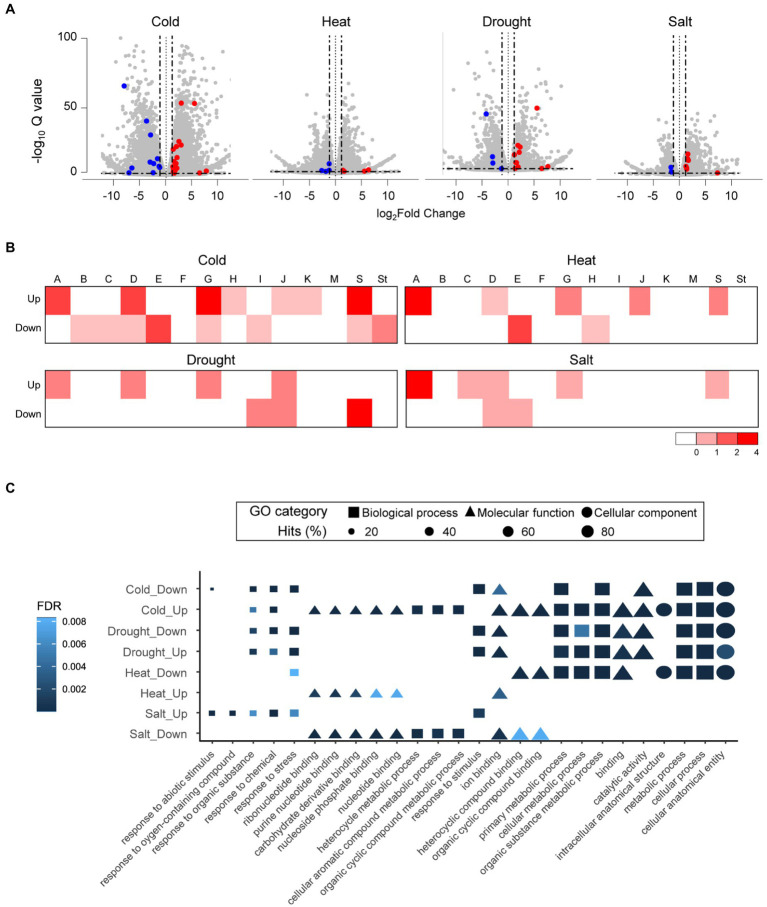
Figure 5.
Expression analyses and functional predictions of differentially expressed genes under different abiotic stresses in tomato (Solanum lycopersicum). (A) Volcano plot for tomato DEGs under different abiotic stresses. Scattered gray dots represent whole genes in tomato. Red and blue dots depict upregulated and downregulated bZIP DEGs based on 1-fold expression difference (represented by two black vertical lines). (B) Number of bZIP DEGs in each subgroup is displayed in a heatmap. Heatmap values on the bottom right side indicate the number of bZIP DEGs in each subgroup. (C) Dot plots depict the top five GO enrichment results for each group including bZIP genes. Shapes represent the GO categories; shape sizes represent the GO term frequencies.

