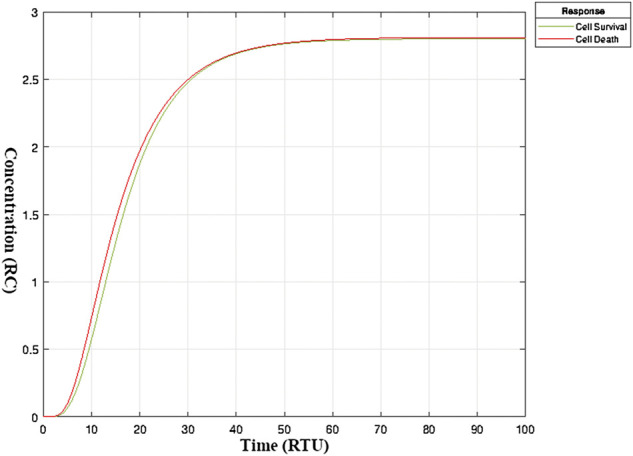
FIGURE 5.

Balanced State of neuronal survival and neuronal apoptosis in mature neurons- Balanced State of neuronal survival and neuronal apoptosis in TNF-α mediated sphingomyelin signaling pathway model under normal circumstances. The y-axis represents the extent or level (in relative concentration) of neuronal survival and apoptosis. The x-axis represents relative time. The two curves, i.e., green and red, are the outcomes of the physiological processes in neurons leading to neuronal survival and death, respectively. The interactive network of signaling pathways keeps neuronal survival and apoptosis in balance (Kole et al., 2013). A shift in one or more of these signaling pathways can alter the fate of a neuron resulting in neuronal death or continued survival (Morrison et al., 2003).
