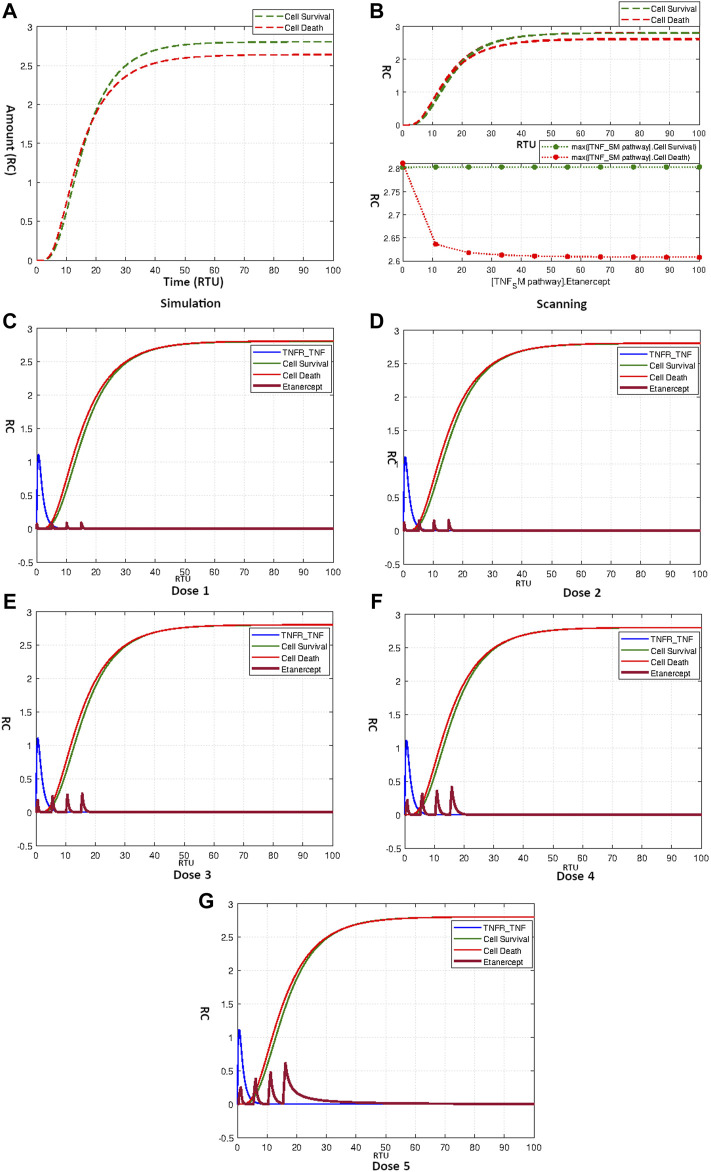
FIGURE 9.
(A) Simulation showing effect of Etanercept on Neuronal Survival and Death. (B) Scanning of Etanercept performed over range 0–100 shows only minor decrease in cell death. (C–G) Figures c to g represent the dosage graphs for Etanercept according to Table 4. Dosages (C–G) have no obvious effect on neuronal death and survival.

