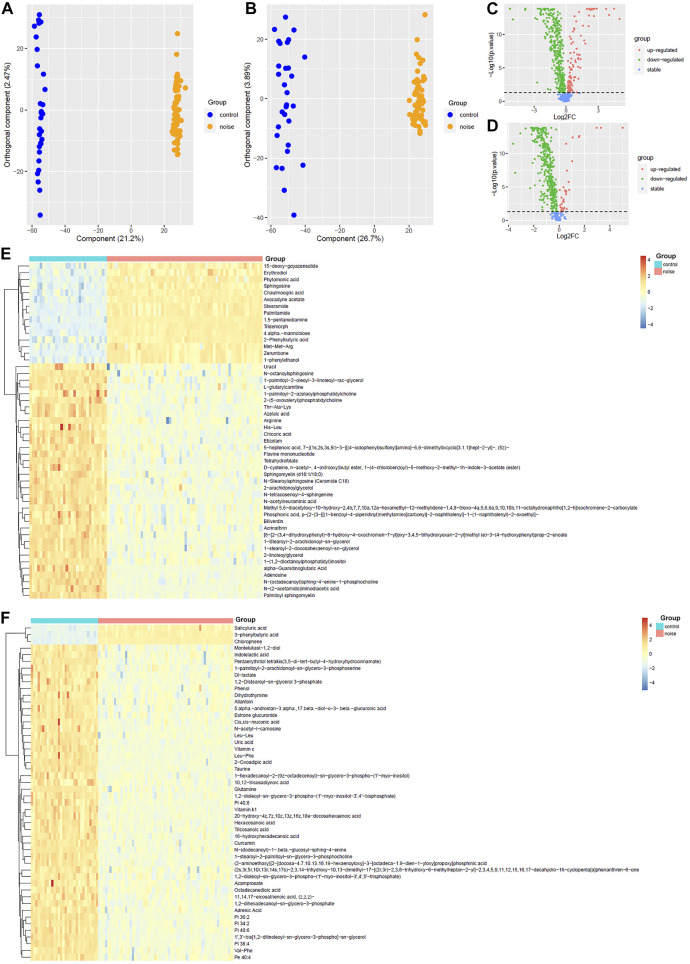
FIGURE 2.
OPLS-DA of the plasma metabolites between the noise group and control group. (A,B) OPLS-DA score plots between the noise group and control group in positive and negative ion modes, respectively. (C,D) Comparisons of the metabolites between the noise group and the control group in the positive and negative mode, respectively. (E,F) Top 50 differential metabolites with the smallest p values and VIP >1 between the noise group and the control group in the positive ion mode and negative ion mode, respectively. The Wilcoxon test and OPLS-DA were used for analyses, and they were performed in R 4.0.3 software. The metabolites with p < 0.05 in the Wilcoxon test and VIP >1 in the OPLS-DA were considered significant. OPLS-DA, orthogonal partial least squares discrimination analysis; VIP, variable importance in projection; log2FC, log2(fold change).

