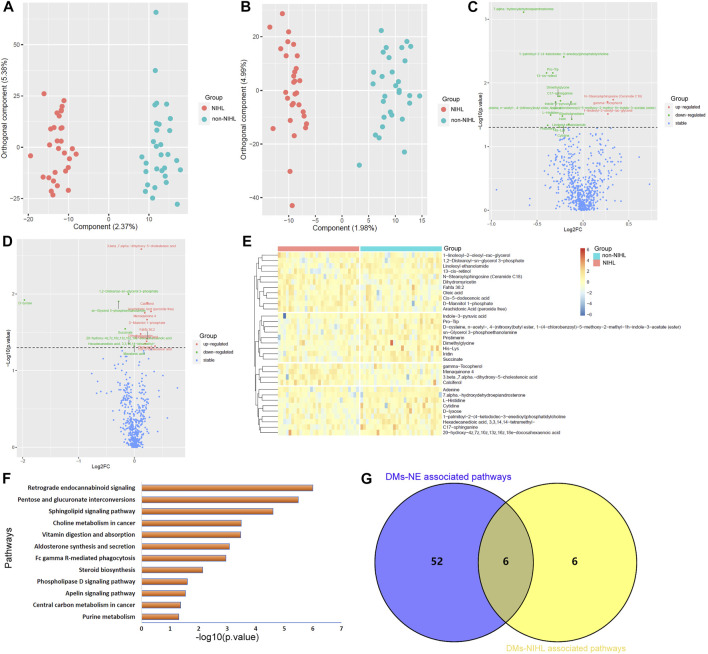
FIGURE 4.
OPLS-DA of the plasma metabolites between the NIHL group and non-NIHL group. (A,B) OPLS-DA score plots between the NIHL group and non-NIHL group in positive and negative ion modes, respectively. (C,D) Comparisons of the metabolites between the NIHL group and the non-NIHL group in the positive and negative ion mode, respectively. (E) Expression profiles of the metabolites with p < 0.05 and VIP >1 (DMs-NIHL) in the NIHL samples and non-NIHL samples. (F) DMs-NIHL were significantly enriched in 12 KEGG pathways. (G) Six common pathways were associated with both DMs-NE and DMs-NIHL. The Wilcoxon test and OPLS-DA were used for analyses, and they were performed by R 4.0.3 software. The metabolites with p < 0.05 in the Wilcoxon test and VIP >1 in the OPLS-DA were considered significant. OPLS-DA, orthogonal partial least squares discrimination analysis; VIP, variable importance in projection; log2FC, log2(Fold change); NIHL, noise-induced hearing loss; non-NIHL, without NIHL. DMs-NE, differential metabolites associated with noise exposure; DMs-NIHL, differential metabolites associated with NIHL.

