Figure 2.
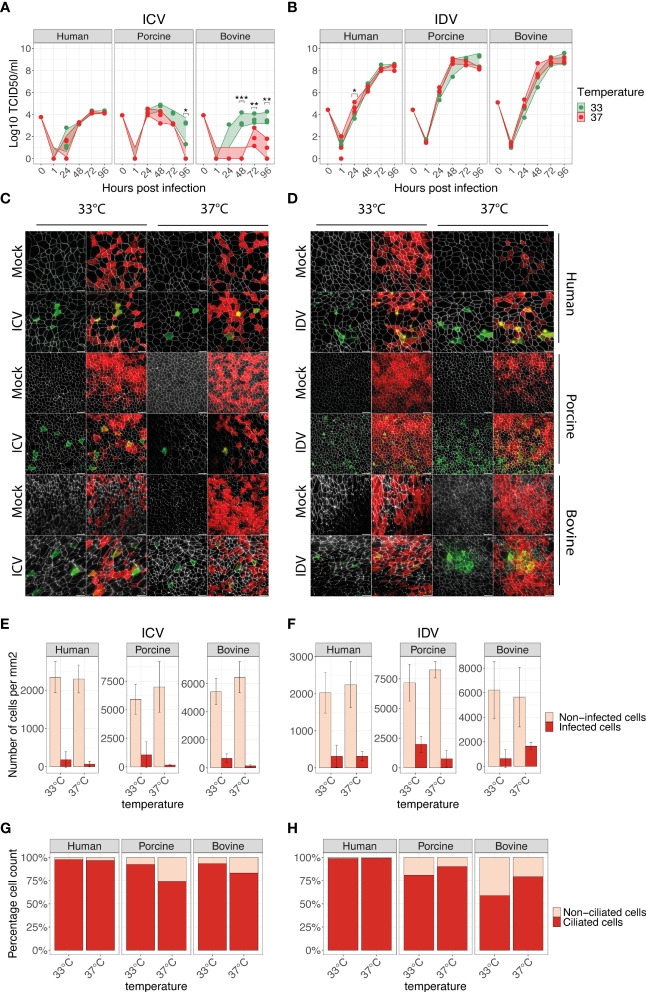
ICV and IDV replication kinetics in human, porcine, and bovine AEC cultures. Well-differentiated AEC cultures from the three different species were infected with ICV (A) or IDV (B) using 10’000 TCID50 or remained uninfected (Mock) and were incubated at 33°C or 37°C. Inoculated virus was removed after 1-hour post-infection (hpi) followed by washing the apical side of the insert. Progeny virus release was assessed by hemagglutination assay at the indicated time post-infection (A, B). Data represent the mean ± SD of AEC cultures from 3 different donors for each species (*p < 0.05, **p < 0.01, ***p < 0.001). Individual biological replicates represent the average of 2 technical replicates. Titers of the inoculum are indicated with 0 hpi, whereas 1 hpi indicates the residual viral titer after the third apical wash. At 96 hpi AEC cultures were formalin-fixed and processed for immunofluorescence analysis using antibodies against ICV (IVIg, green) (C) or IDV (anti-NP, green) (D), ZO-1 (tight junctions, white) and β-tubulin (cilia, red). Representative z-projections of control and virus-infected human, porcine, and bovine AEC cultures are shown. Scale bar: 20 µm (C, D). Quantification of ICV (E) and IDV (F) antigen-positive (dark red) and negative (light red) cells per mm2 using automated segmentation of individual cells based on the ZO-1 staining. Data represent the mean ± SD of 48 images acquired per condition (total 576) from 3 different donors for each species (E, F). Determination of ICV (G) and IDV (H) cell tropism by quantifying the percentage of virus-antigen positive cells overlapping with either ciliated (dark red) or non-ciliated (light red) cells. The mean percentage from all previously quantified virus-antigen positive cells for each temperature and host species is displayed (G, H).

