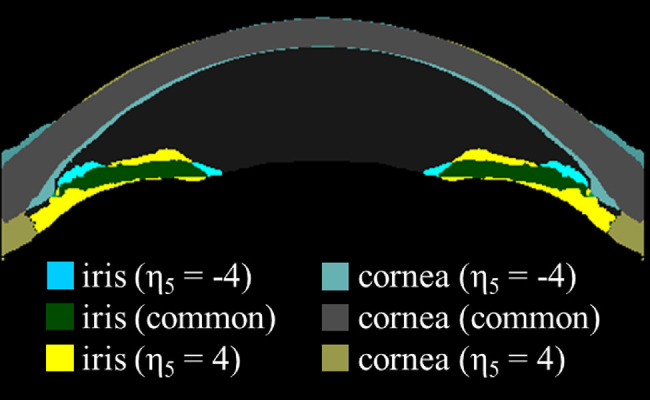
Figure 3.

Subtraction image of for z values −4 and 4. Areas that correspond to are color-coded in yellow tone while areas that correspond are color-coded in blue tone. Gray color represents an area of the cornea which is common to both z values and green color represents areas of iris common to both z values.
