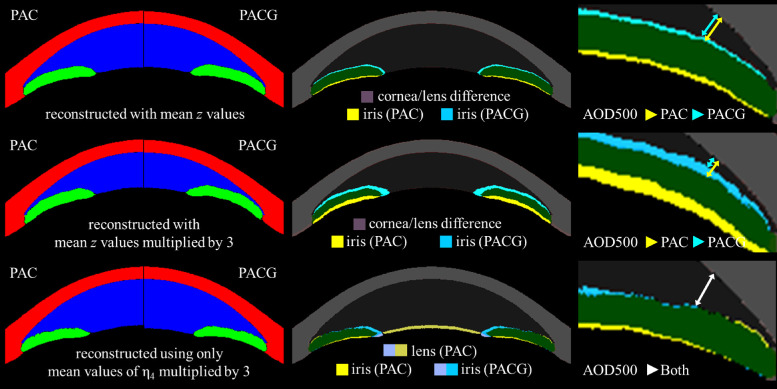
Figure 4.
Reconstructed images representing PAC and PACG eyes from selected mean values of latent variables of each group. Top row: mean values of , middle row: tripled mean values of , bottom row: tripled mean values of . Left column: plain segmented images, middle column: difference map, right column: magnified difference map of the angle with approximate AOD500 marked with arrows. We can see that PACG eyes seem to have a narrower angle (top row, right column) which is more pronounced if we multiply latent variables by 3 (middle row, right column). However, there was no noticeable difference in the width of the angle regarding only (bottom row, right column). It implies that despite significant statistical difference between two disease groups in , narrower angle in PACG is not a direct result of but rather a result of combination all latent variables.

