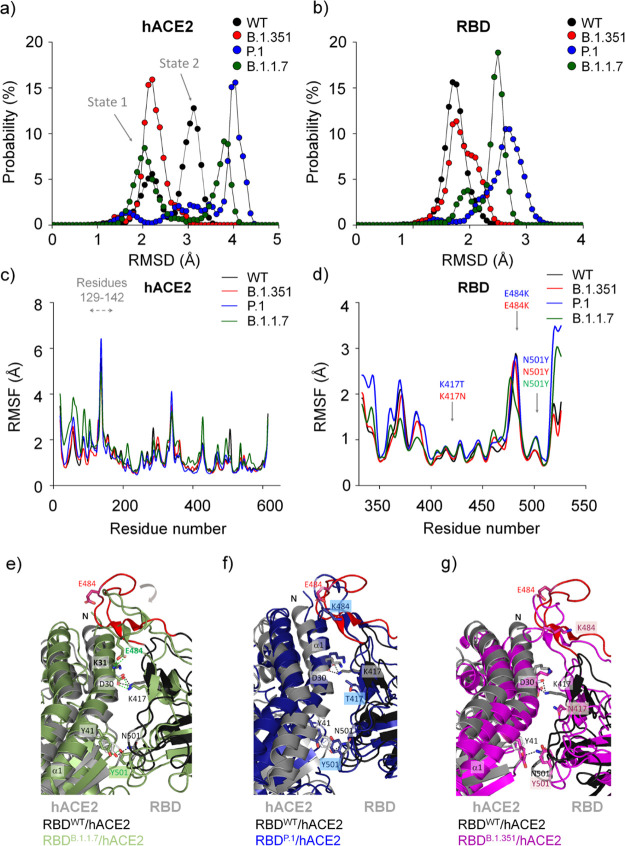
Figure 2.
Structural aspects obtained by molecular dynamics simulations of different SARS-CoV-2 RBD variants while interacting with hACE2. Backbone RMSD probability distributions are shown for (a) hACE2 and (b) RBD. Backbone RMSF are shown for (c) hACE2 and (d) RBD. The Panels (e–g) show different conformational changes of each RBDvariant/hACE2 complex in relation to the RBDWT/hACE2 complex. Note that the main structural differences are localized in the loop 474–488 caused by the N501Y mutation in RBDB.1.1.7 (e) that is partially recovered in RBDP.1 (f) and RBDB.1.351 (g). Residues 469−490 are colored in red in the RBDWT/hACE2 complex. The structure models of RBDWT/hACE2, RBDB.1.1.7/hACE2, RBDP.1/hACE2 and RBDB.1.351/hACE2 were taken from a snapshot at 40 ns, 19 ns, 61 ns, and 42 ns, respectively, from each MD simulation trajectory. We observed in another independent calculation simulated for 300 ns for hACE2 in complex with RBDWT, RBDB.1.1.7, and RBDP.1, showing the same structural behavior (Figures S15–S17).

