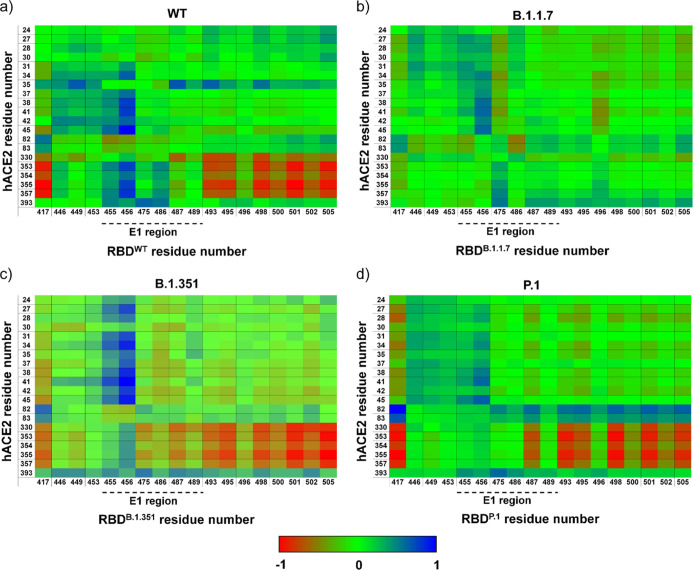
Figure 3.
Correlation matrix obtained by MD trajectories of RBD and its variants interacting with hACE2. Painels (a–d) show heat maps representing the correlation matrix of the interface residues. Anti-correlated and correlated pairs are colored in red and blue, respectively. Note that correlated and anti-correlated pairs are affected in E1 and E2 regions of RBD variants, mostly in RBDB.1.1.7. Heat maps of RBDB.1.351 and RBDP.1 have similar patterns to that of RBDWT.

