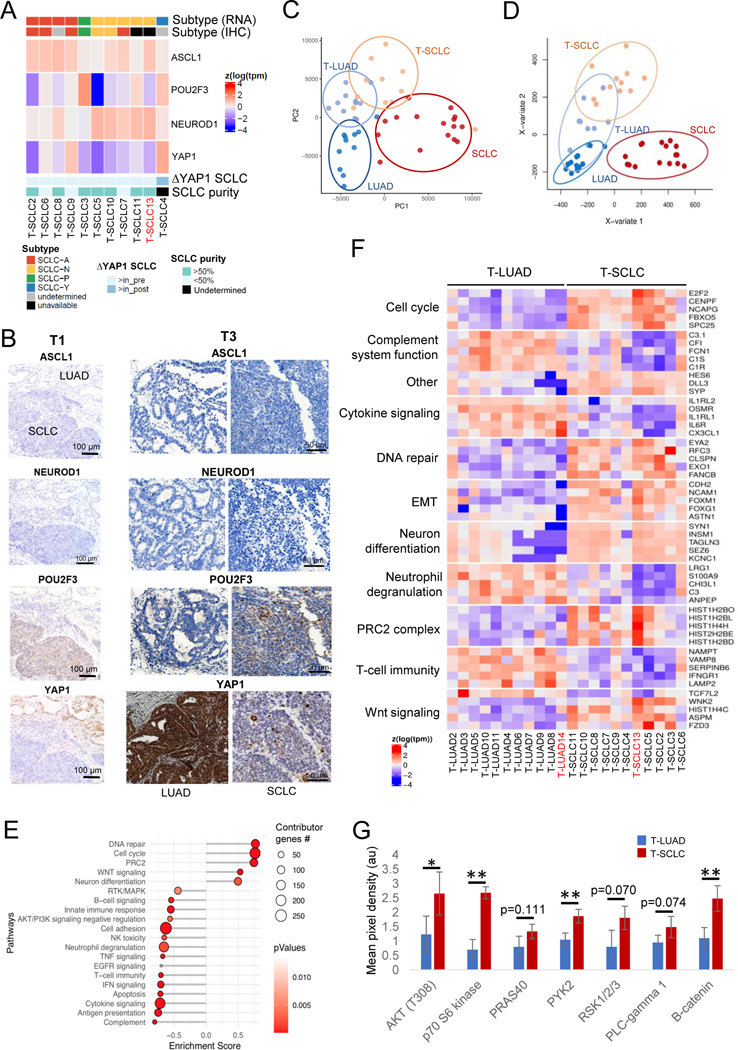
Figure 4. Transcriptomic, epigenomic and protein characterization of SCLC transformation.
Related to Supplementary Figures S4–5. (A) Heatmap showing mRNA expression of the SCLC subtype-determining TFs, tumor purity, highest TF expressed by IHC in the T-SCLC component and YAP1 mRNA expression in the T-SCLC component relative to their matched T-LUAD component, in the transformation samples. (B) IHC images for subtype-determining TFs in the SCLC-P T-SCLC cases (ch1 and ch3). (C) PCA analysis on the transcriptomes of our pre- and post-transformation samples, and of our control LUAD and de novo SCLC samples. (D) PLSDA analyses on the methylome of our T-LUAD and T-SCLC samples, and of our control LUAD and SCLC samples. (E) Pathway enrichment analyses on the DEGs of the T-LUAD versus T-SCLC comparison. (F) Heatmap highlighting DEGs of interest, grouped by recurrent pathways. (G) Bar plot showing differential phosphorylation of genes involved in the AKT/Wnt signaling pathways, and differential expression of β-catenin, as determined by an antibody array on pre- and post-transformation clinical and PDX samples. Samples IDs in black and red indicate that they come from a combined histology specimen or a pre-/post-transformation specimen, respectively. p-values legend: * p<0.05, **p<0.01.

