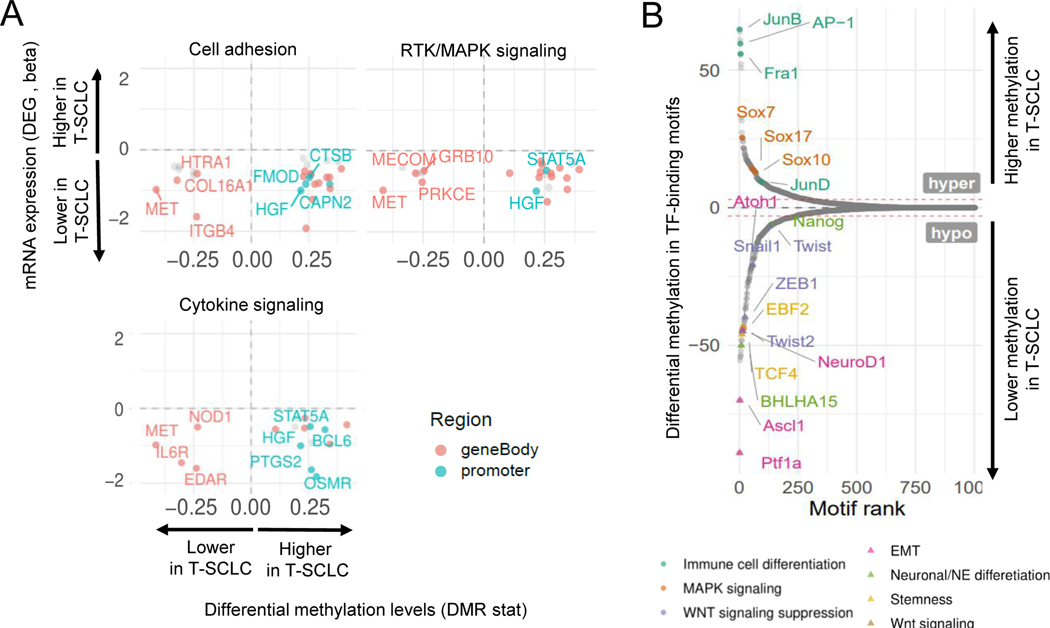
Figure 5. Integrative RNA and methylation analyses of SCLC transformation.
Related to Supplementary Figure S4. (A) Scatter plots showing DEGs exhibiting differential methylation levels in T-LUAD versus control LUAD comparison, grouped by pathways of interest. Significantly differentially expressed (q value < 0.05 and beta >= log2(1.5)) and methylated (FDR < 0.5 and differential methylation level greater than 0.1) sites are highlighted. Those genes where increased gene body or promoter methylation is correlated to expression positively and negatively, respectively, are labeled. (B) Plot exhibiting differentially methylated transcription factor binding domains in T-SCLC versus T-LUAD. Interested TFs in this study are highlighted and labeled.

