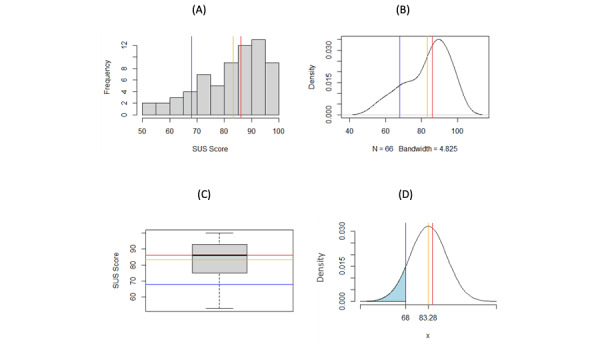
Figure 2.

Analysis of SUS distribution for physical activity apps only: A) histogram of SUS scores, B) density plot of SUS scores, C) boxplot of SUS scores, and D) normal curve probabilities of SUS scores for all categories (mean 83.28, SD 12.39; shaded area: 0.1088). Blue line=68 (average SUS score for apps), red line=86 (median), orange line=83.28 (mean). SUS: System Usability Score.
