Figure 6.
GPNMB-high macrophages ineffectively retain T cells from activating by DCs.
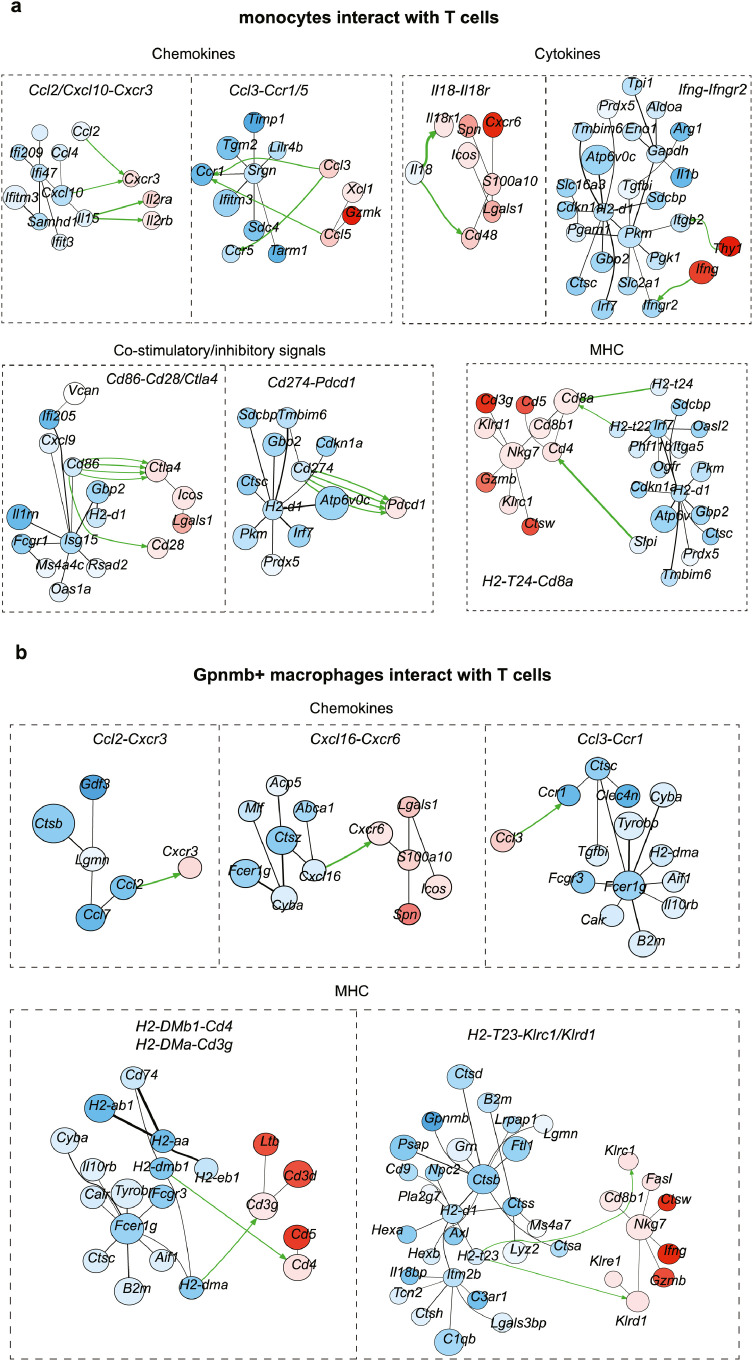
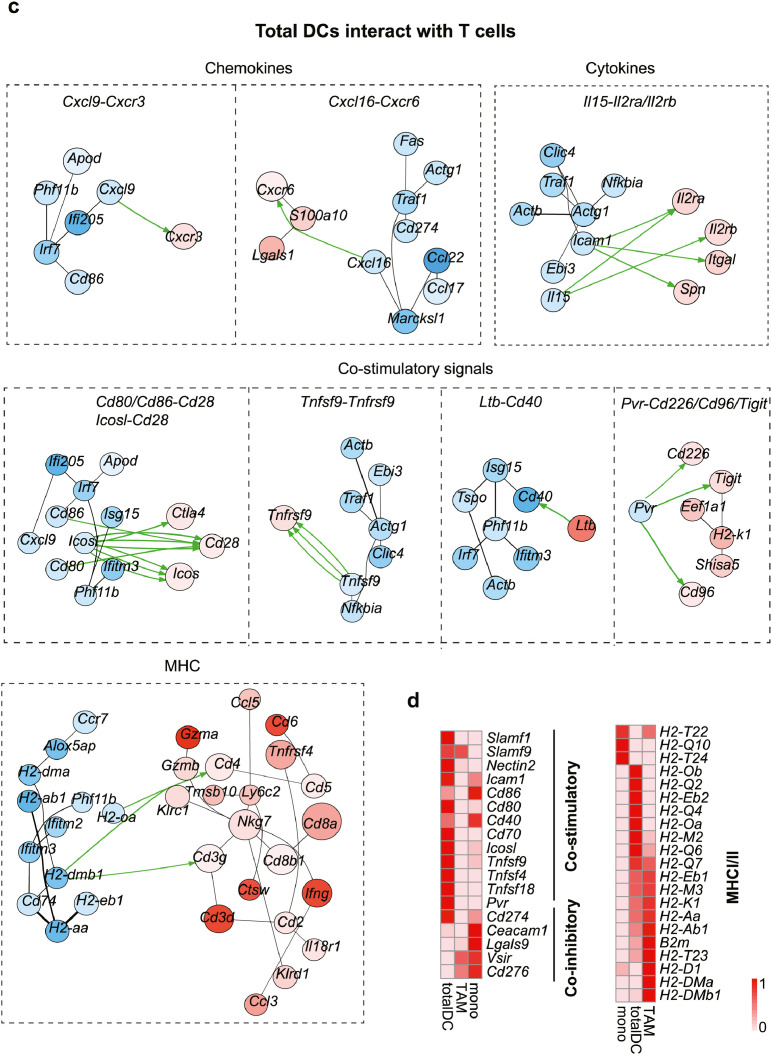
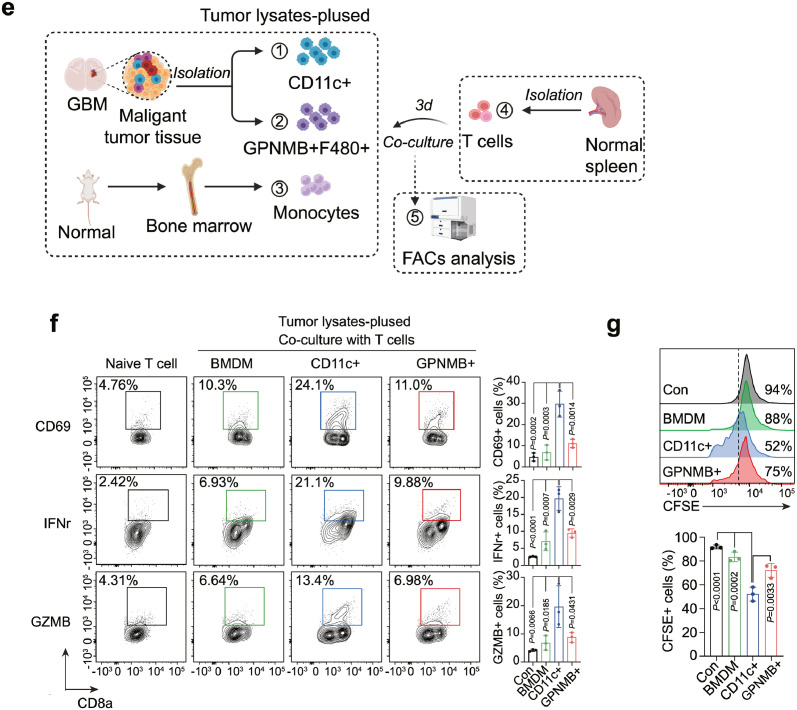
Gpnmb-high macrophages, monocytes, total dendritic cells and T cells were sub-clustered and applied to CytoTalk analysis. Major inter-and intracellular communications are shown between (a) monocytes and T cells, (b) Gpnmb-macrophages and T cells, (c) dendritic cells and T cells. Important categories including chemokines, cytokine, co-stimulatory signals, and antigen presentation machinery are displayed. Blue encodes monocytes/macrophages/dendritic cells, while red encodes T cells. Color shade of gene nodes represents the proportional to the cell-type specificity. The size of nodes indicates the average expression of genes in each cell type. (d) The relative expression of inhibitory and stimulatory molecules on monocytes, macrophages and dendritic cells. (e) F4/80+GPNMB+ macrophages, CD11c+ dendritic cells and bone marrow-derived monocytes were isolated and subsequently pulsed with tumor lysates prior to co-culturing with naïve T cells for 3 days. (f) The expressions of CD69, IFNγ and GZMB as well as the (g) proliferation of T cells were analyzed using flow cytometry. Statistical analysis by one-way ANOVA (n=3, independent biological replicates, mean ± SD). (For interpretation of the references to color in this figure legend, the reader is referred to the web version of this article.)


