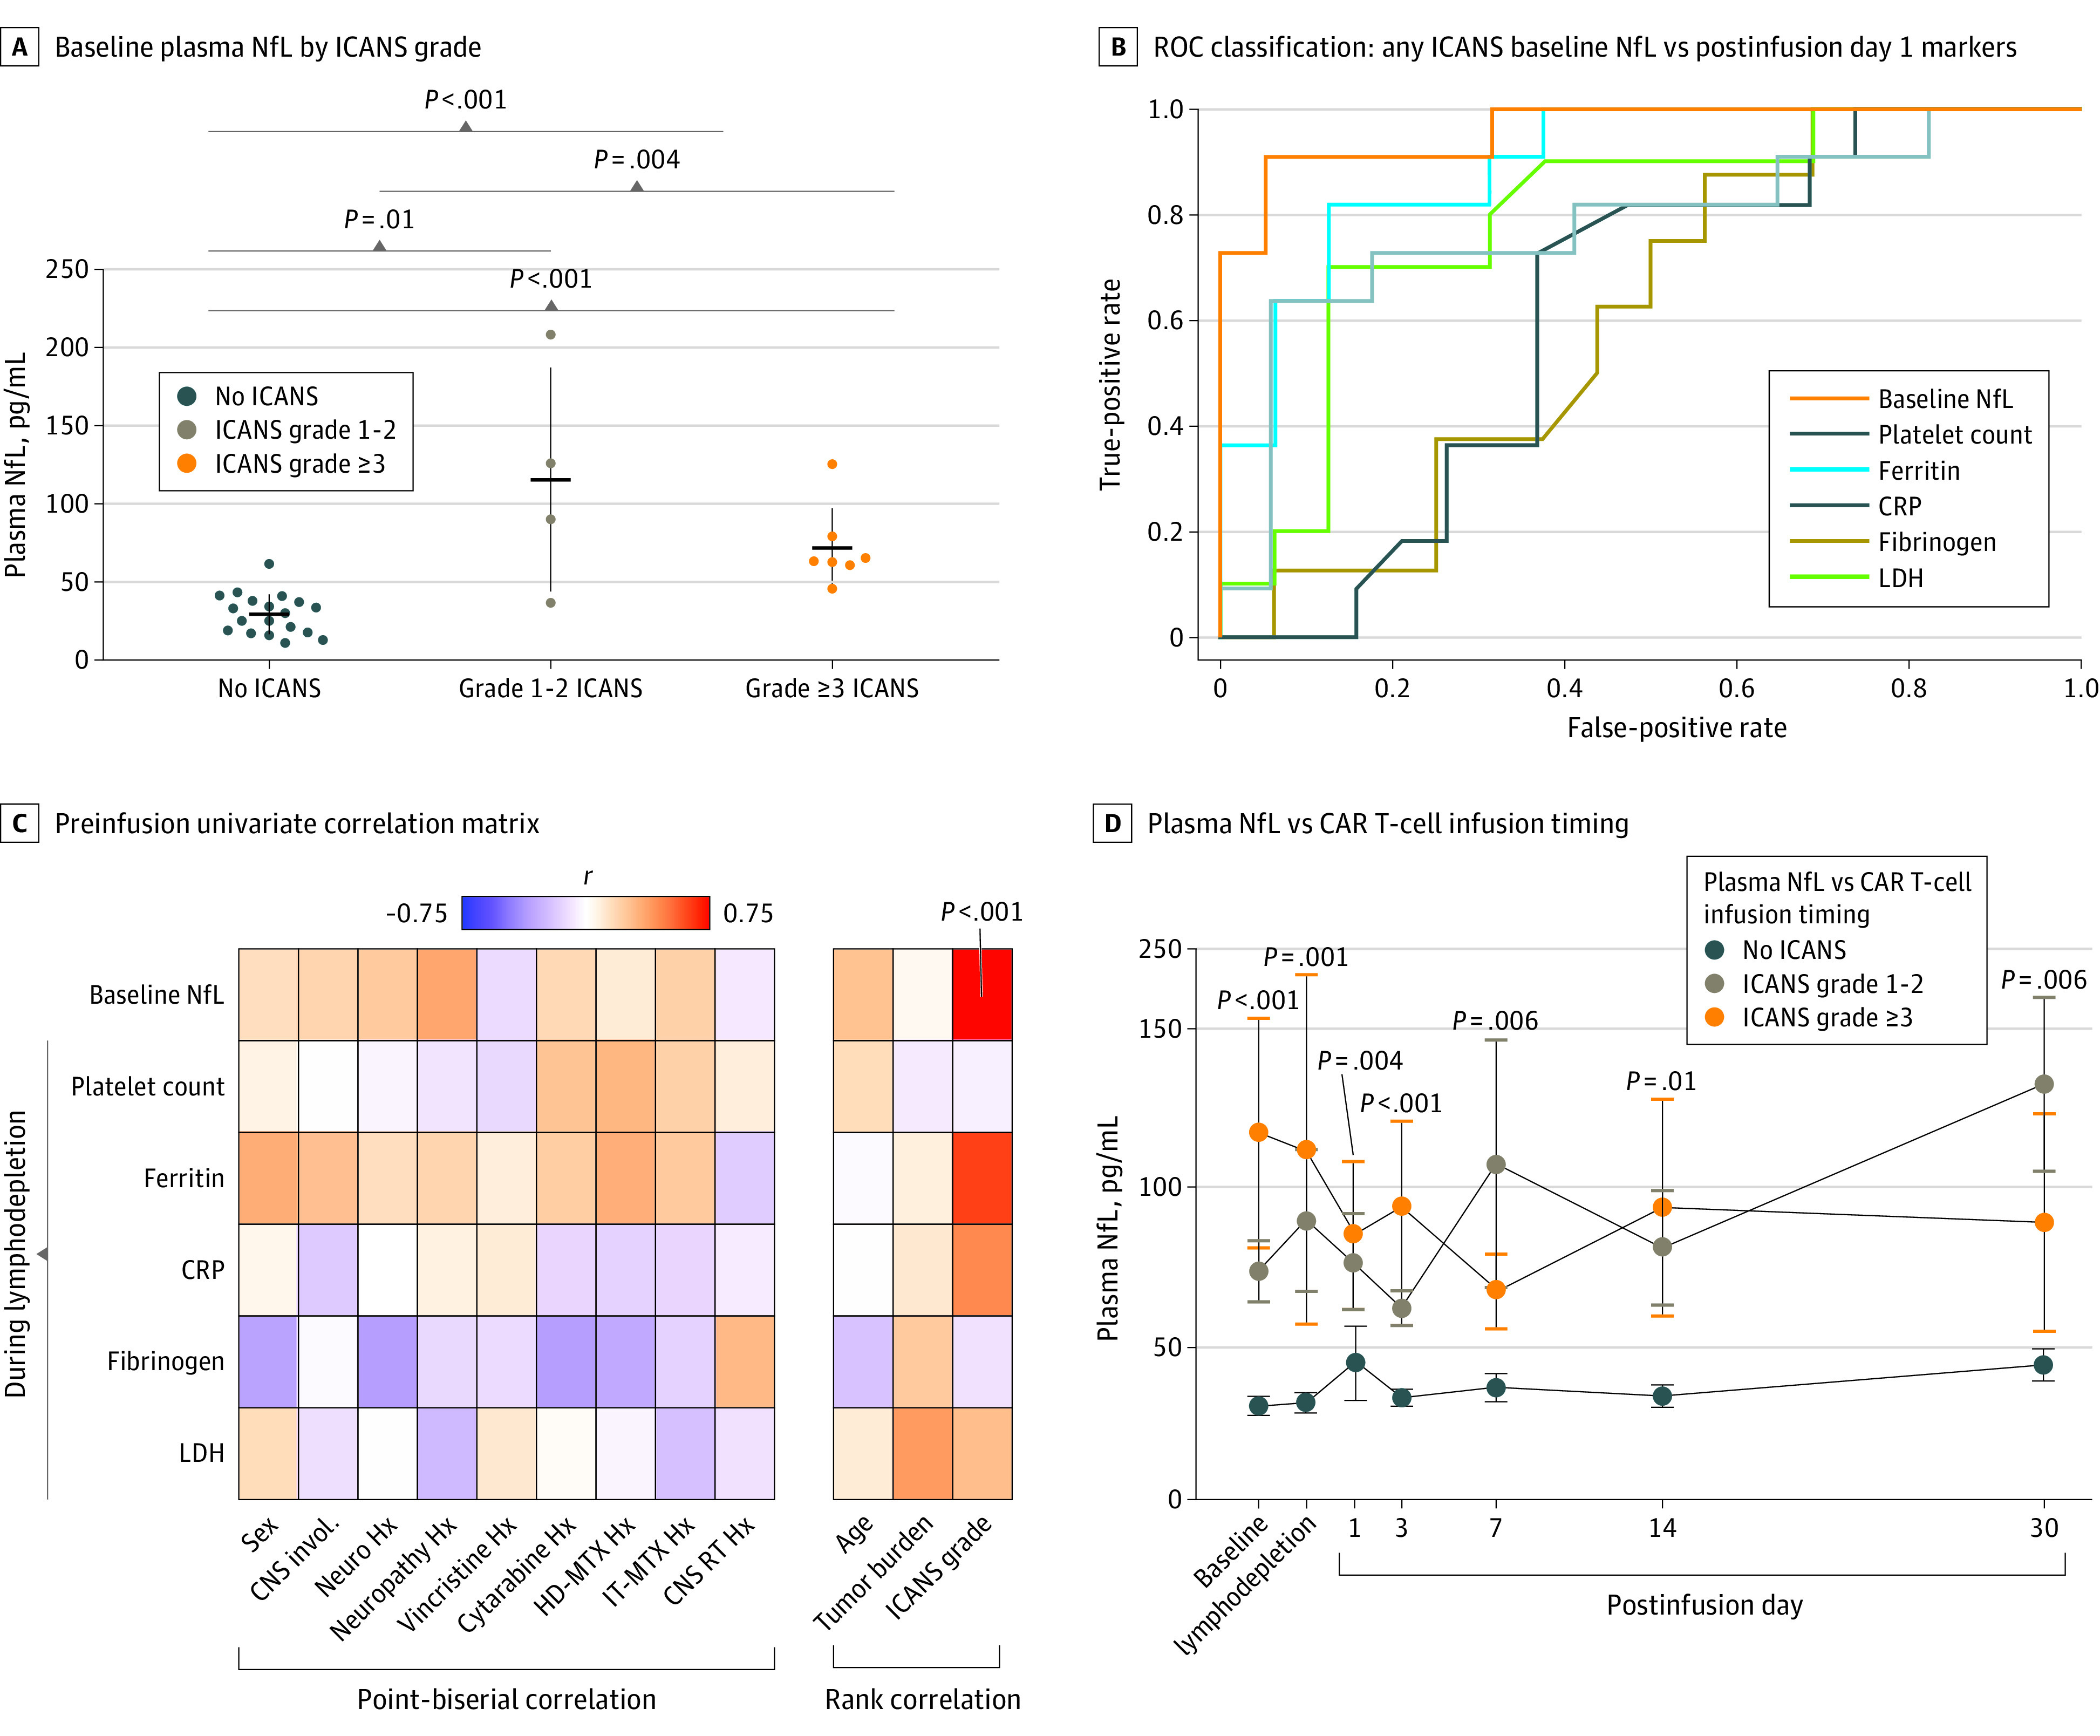
Figure. Association Between Neurofilament Light Chain (NfL) Levels and Immune Effector Cell–Associated Neurotoxicity Syndrome.

A, Baseline (preinfusion) plasma NfL levels divided by immune effector cell–associated neurotoxicity syndrome (ICANS) grade. B, Receiver operating characteristic (ROC) classification of patients who develop any grade ICANS (≥1) vs no ICANS (grade 0) for baseline NfL level and available postinfusion day 1 markers. C, Univariate correlation between pretreatment factors and available preinfusion biomarkers. D, Blood plasma NfL levels relative to timing of lymphodepletion and chimeric antigen receptor (CAR) T-cell infusion; group comparisons here were between any grade ICANS (≥1) vs no ICANS (grade 0). Multiple comparison validation per false discovery rate. CNS indicates central nervous system; CRP, C-reactive protein; HD, high-dose; Hx, history; IT, intrathecal; LDH, lactate dehydrogenase; Neuro, neurologic disease; MTX, methotrexate; RT, radiotherapy.
