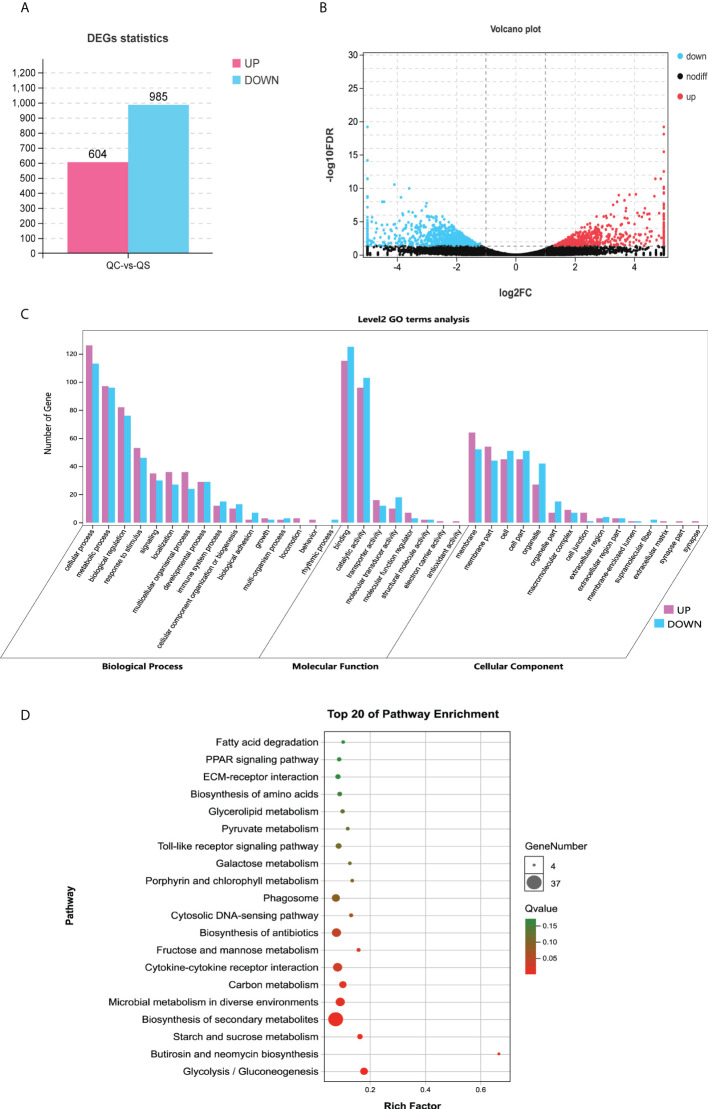
Figure 3.
Identification and functional annotation of differentially expressed genes. (A) Histogram shows differentially expressed genes. Blue and red indicate decreased and increased expression, respectively. (B) Volcano map shows differentially expressed genes. The abscissa represents the fold change values of samples in control group/samples infected by V. parahaemolyticus, the vertical coordinate represents statistical test value [-lg (FDR)], the lower represent the more significant differences. Red dots represent up-regulated genes and blue dots represent down-regulated genes (FDR <0.05, |log2FC|>1), and black dots represent no significant difference genes. (C) GO enrichment analysis of DEGs. The abscissa indicates 3 GO categories with 39 GO terms, and the vertical coordinate indicates the number of unigenes. (D) KEGG pathway analysis of DEGs. The abscissa represents the ratio of DEGs to all genes annotated to the pathway and the vertical coordinate represents the pathways. The redder bubble indicates more obvious enrichment, with smaller Q-value. The larger bubble contains more differentially expressed genes. DEGs, differentially expressed genes; GO, Gene Ontology; KEGG, Kyoto Encyclopedia of Genes and Genomes.

