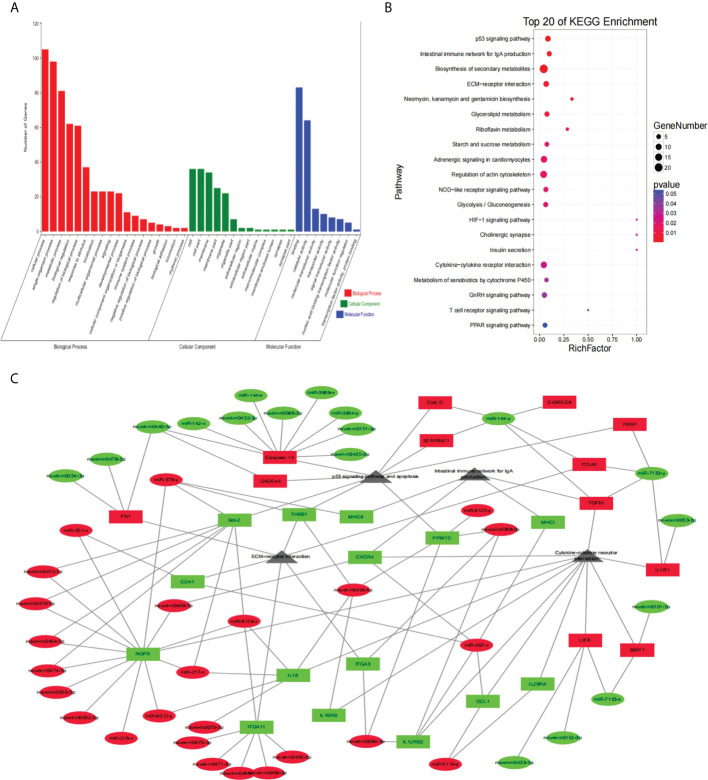
Figure 5.
Functional annotation analysis of target DEGs of DEMs and network for miRNA-mRNA-Pathway interaction. (A) GO enrichment analysis of target DEGs of DEMs. The abscissa indicates 3 ontologies (molecular function, cellular component and biological process) with 39 GO terms, the vertical coordinate indicates the genes count. (B) KEGG pathway analysis of target DEGs of DEMs. The abscissa represents the ratio of the number of genes in the DEGs and the vertical coordinate represents the pathways. The redder bubble indicates more obvious enrichment, with smaller P-value. The larger bubble contains more target genes. (C) Network diagram for miRNA-mRNA-Pathway interaction. Ellipse represents miRNA, Round Rectangle represents mRNA, Triangle represents signaling pathway; Red color indicates up-regulated, blue color indicates down-regulated, gray color indicates no difference. DEGs, differentially expressed genes; DEMs, differentially expressed miRNAs; GO, Gene Ontology; KEGG, Kyoto Encyclopedia of Genes and Genomes.

