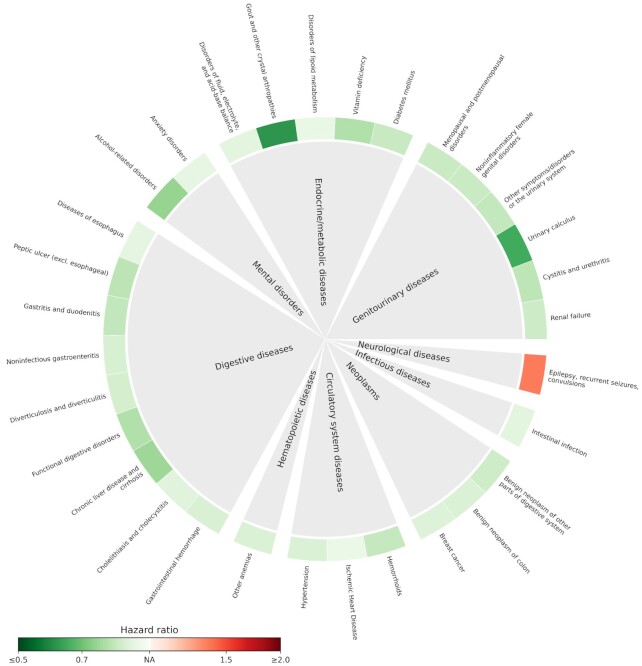
FIGURE 2.
RRs of subsequent medical conditions for high-level coffee consumption compared to low-level coffee consumption (n = 191,399). The outer ring shows the point estimates of HRs of identified medical conditions that were statistically significantly associated with high-level coffee consumption after correction for multiple testing (i.e., false discovery rate–adjusted P value < 0.05). HRs were derived from a Cox model, adjusted for age, sex, Townsend deprivation index, household income, BMI, tea intake, smoking status, alcohol drinking status, physical activity, and fruit and vegetable consumption. The red color indicates a higher risk (i.e., HR > 1) and the green color shows a lower risk (i.e., HR < 1). The degree of color represents the magnitude of the corresponding association. Detailed results are shown in Supplemental Table 4.

