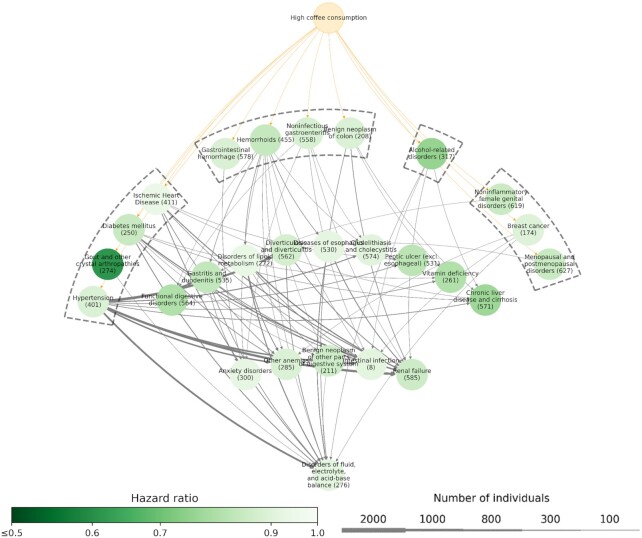
FIGURE 3.
Disease-trajectory network of medical conditions with a lower risk in relation to high-level coffee consumption (n = 191,399). Each node represents a medical condition, with the color of the node representing the HR of the corresponding medical condition when comparing individuals with high-level coffee consumption to those with low-level coffee consumption, according to an adjusted Cox model. The width of the lines connecting 2 nodes represents the number of individuals with the corresponding disease trajectory.

