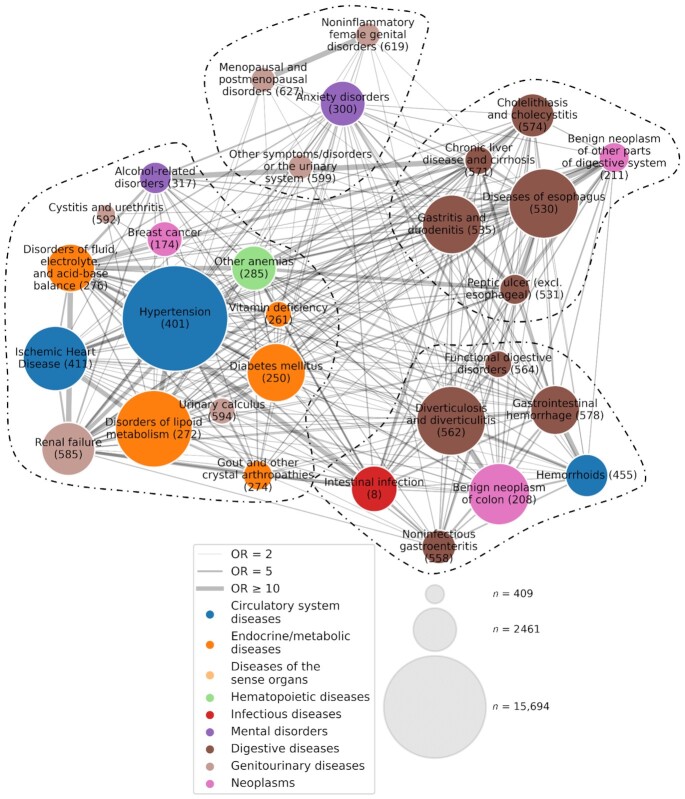
FIGURE 4.
Comorbidity network of medical conditions with a lower risk in relation to high-level coffee consumption (n = 191,399). Each node represents a medical condition and is labeled with its name and “phecode.” The size and color of each node indicate the prevalence and the category of the corresponding medical condition, respectively (see legend). The width of the link represents the strength of the comorbidity association, measured by ORs obtained from an adjusted logistic regression. The network is partitioned into 4 modules using a Louvain algorithm, and nodes belonging to the same module are grouped together and separated from other nodes using dashed lines.

