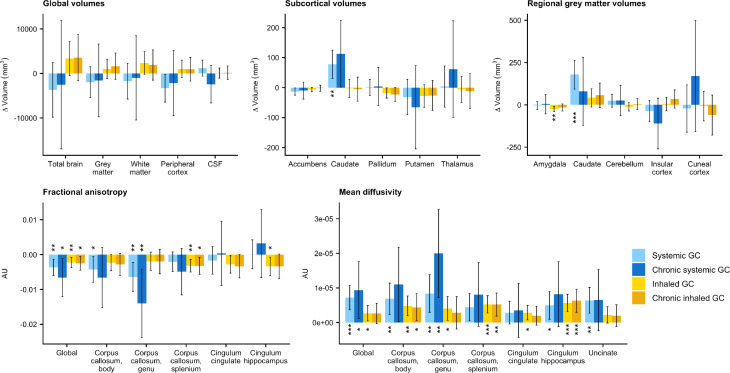
Figure 3.
Bar plots showing the adjusted mean difference (with 95% CI) of all imaging parameters for patients using systemic glucocorticoids (GC) (n=222) or inhaled GC (n=557), and subgroups of chronic systemic GC users (n=42), or chronic inhaled GC users (n=305) vs controls (n=24 106). Significance levels compared with controls: *p<0.05, **p<0.01, ***p<0.001. AU, arbitrary unit.

