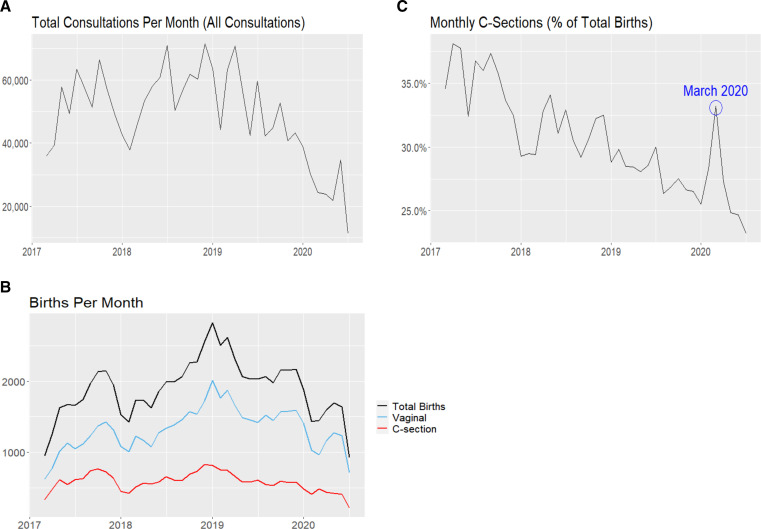
Figure 2.
(A) This figure shows the total number of consultations (all presentations) per month between March 2017 and July 2020. (B) This figure shows the number of births per month delivered by caesarean sections or vaginal birth. In boxes are two time periods in which there are declines in the numbers of births. (C) This figure shows the caesarean section rates as a percentage of the total births across all SAMS’ health facilities per month between March 2017 and July 2020. SAMS, Syrian American Medical Society’s.

