Fig. 2.
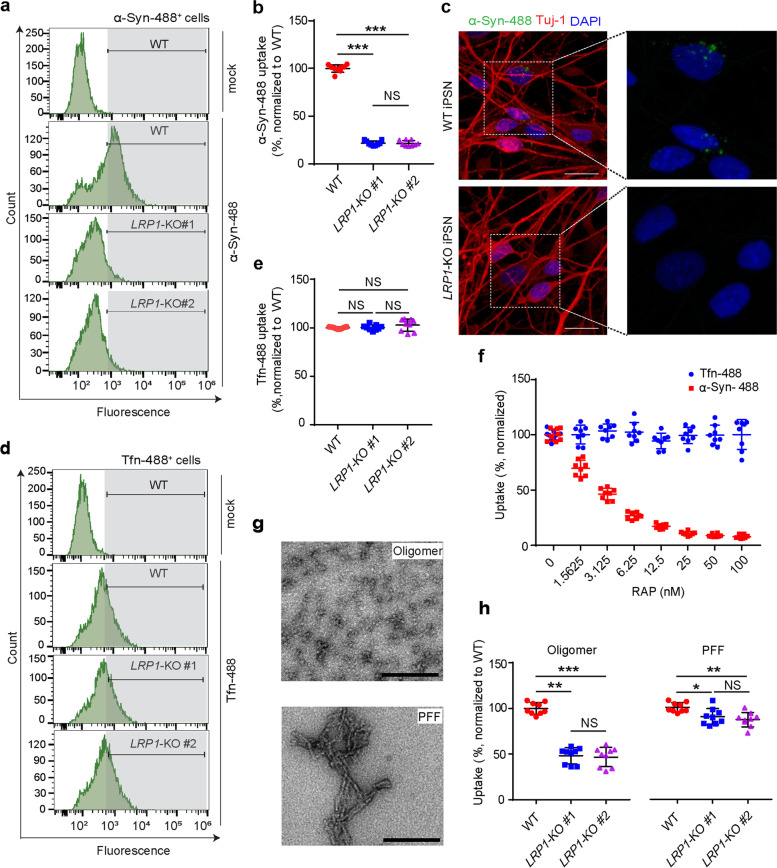
LRP1 regulates α-Syn uptake in iPSNs. a and b, α-Syn uptake in WT and LRP1-KO iPSNs measured by flow cytometry (100 nM, 3 h of treatment). c Representative images of WT or LRP1-KO iPSNs after α-Syn uptake. Scale bars, 20 μm. d and e, Transferrin (Tfn) uptake in WT and LRP1-KO iPSNs measured by flow cytometry (300 nM, 3 h of treatment). f Uptake of α-Syn and Tfn in the presence of increasing concentrations of RAP. g EM images showing the structure of α-Syn oligomers and preformed fibrils (PFFs) used in panel h. Scale bars, 200 nm. h Uptake of α-Syn oligomers and PFFs in WT and LRP1-KO iPSNs (100 nM monomer equivalent, 3 h of treatment). All experiments in (a, b, d, e, f and h) were performed in technical duplicates or triplicates over three independent experiments. All data are expressed as mean ± s.d. with individual data points shown. Data were analyzed by One-way ANOVA with Tukey’s multiple comparisons test. NS, not significant; *P < 0.05, **P < 0.01, ***P < 0.001

