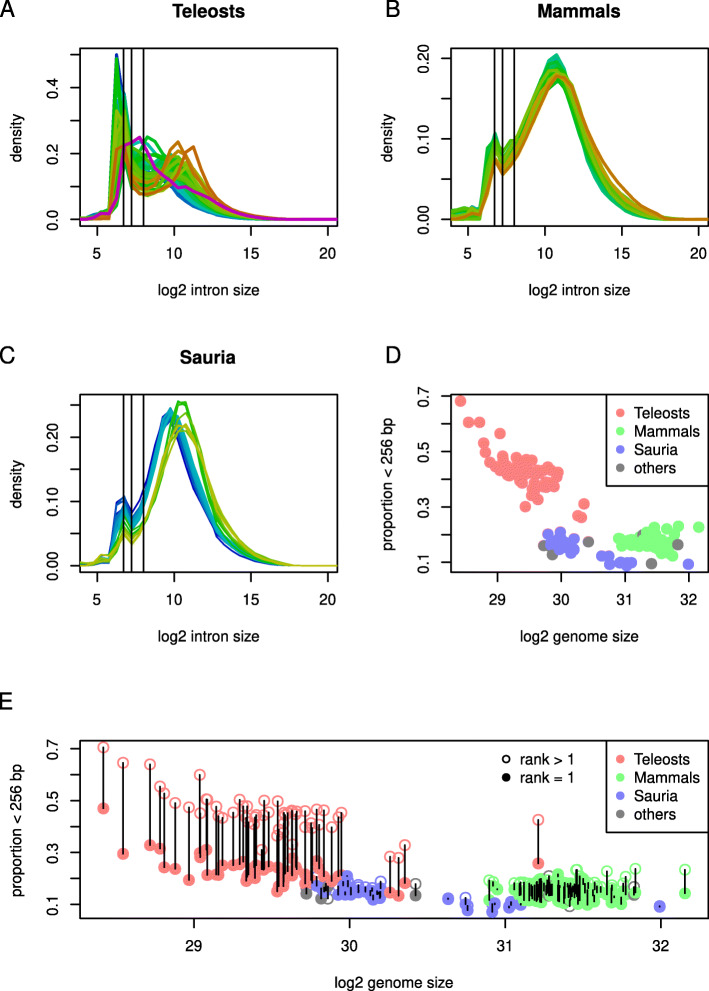
Fig. 1.
Vertebrate intron size. A-C, distributions of log2 intron size in teleosts (A), mammals (B) and Sauria (C). Colour of lines indicate log genome size from blue (small) to purple (large); x-axis, log2 intron size, y-axis density. Distributions for teleosts are much more varied than for mammals or Sauria, but are generally bimodal with an antimode at 28 bases (indicated by vertical line). The distributions of mammals and Sauria also suggest bimodality with a peak of shorter introns at 105 bp. Distributions for Sauria separate naturally into two groups of different genome size ranges; these correspond to Aves (birds) and non-Aves species, with Aves species (blues) having both smaller genomes and introns. D, log2 genome size (x-axis) plotted against the fraction of introns shorter than 28 base pairs (y-axis). Colour indicates taxonomic membership as indicated. E, points plotted as in (D), but divided into first introns (filled circles, rank = 1) and other introns (rank > 1). Pairs of points for each species are joined by vertical lines. First introns are much less likely to be smaller than 28 bp in teleosts

