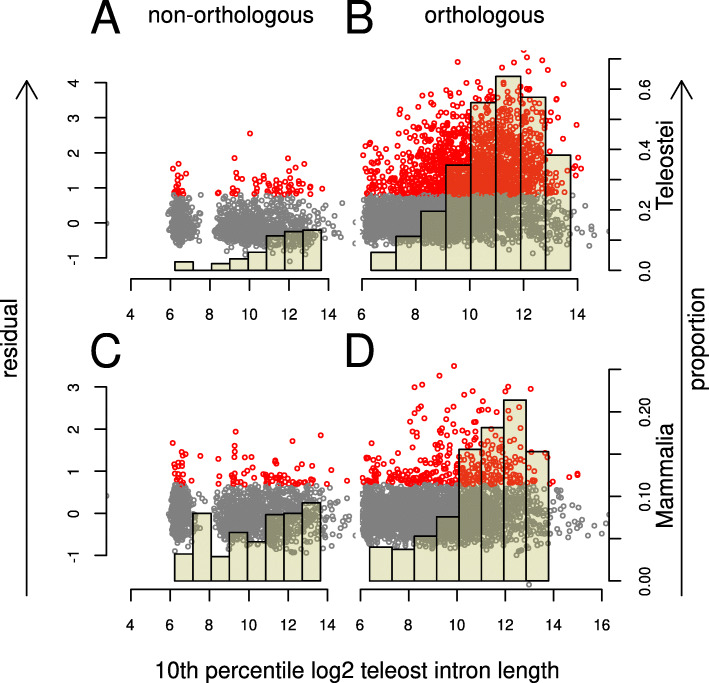
Fig. 7.
Conservation of intron sequences. Intron orthologue sets were chosen by their minimal length in teleosts and the D. rerio intron sequence locally aligned (Smith-Waterman) to the orthologues of the set (B, D). As a control, we also aligned a non-orthologous D. rerio sequence to each orthologue set (A, C). The top-scoring alignment for each orthologue set was identified and filtered to remove repeat sequences. The remaining control alignments were used to construct a null model relating the search space (, where ldr is the D. rerio, and l∉dr the other intron lengths) to the frequency of alignment scores). Plots show the deviation from the null models for teleosts (A, B) and mammals (C, D) plotted against 10th percentile teleost intron length with each point representing the maximally scoring alignment for a given orthologue set. Points in red are outside of the 95th percentile of model residual values. Bars show the proportion of points within the indicated range that are outside of the 95th percentile (right y-axis). Left panels (A, C) show data from the control alignments of non-orthologous sequences and indicate that the model only partially compensates for the increase in search space since we observe higher residuals for longer teleost introns. Nevertheless it is clear that an increased teleost intron length is associated with an increased sequence conservation and that this effect is not limited to teleost sequences

