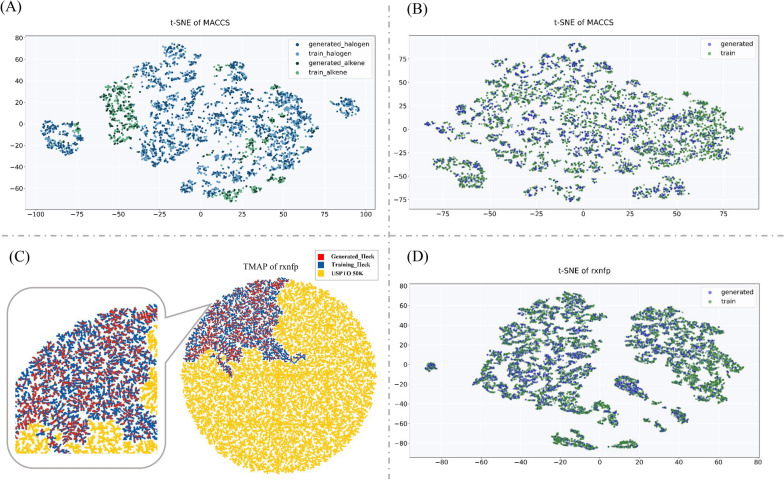
Fig. 4.
The plot of distribution of reactants, products and reactions. A The t-SNE plot of MACCS of reactants. Halogenated aromatics from the training set (blue) and generated set (deep blue), and alkenes from the training set (green) and generated set (deep green). B The t-SNE plot of products from the training set (green) and generated set (blue). C The TMAP plot of reactions from the training set (blue), generated set (red) and USPTO 50 K (yellow). D The t-SNE plot of rxnfp of reactions from the training set (green) and generated set (blue)

