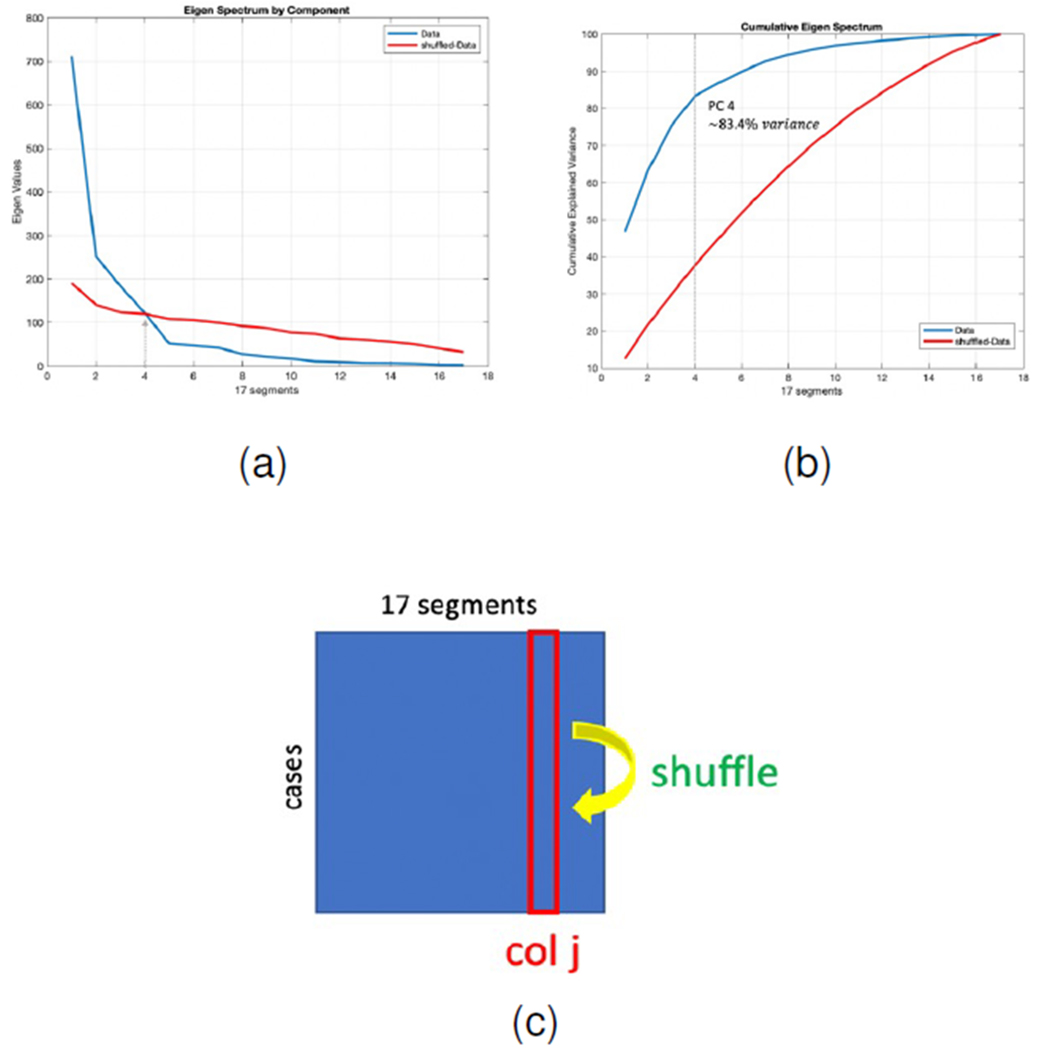
Fig. 15.

(a): Eigen spectrum comparison of the original and shuffled polar plots. (b): Cumulative explained variance of the original and shuffled data, first 4 PCs explain more than 83% of the data variance. (c): Schematic picture showing how data is shuffled to remove correlation between the segments
