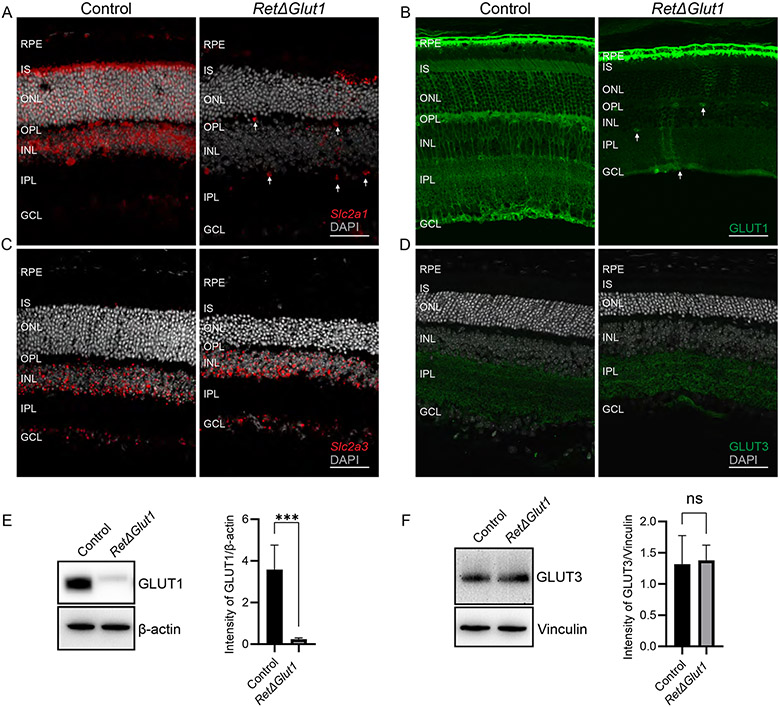
FIGURE 2. Deletion of GLUT1 from the retina does not result in compensatory changes in expression of GLUT3.
A) In situ hybridization to detect the localization of Slc2a1. The RetΔGlut1 mice had a loss of Slc2a1 (red) signal in the inner and outer retina with intermittent expression. Slc2a1 expression seen in inner retinal blood vessels (as indicated by white arrows) and the RPE (Scale bar indicates 50 μm).
B) Immunostaining of GLUT1 (green) in control and RetΔGlut1 mice. White arrows indicate GLUT1 expression in inner retinal blood vessels. (Scale bar indicates 50 μm).
C) In situ hybridization of Slc2a3 from control and RetΔGlut1 mice at 1-month of age. (Scale bar indicates 50 μm).
D) Immunostaining of GLUT3 (green) in control and RetΔGlut1 mice at 1-month of age. (Scale bar indicates 50 μm).
E) Western blot analysis of GLUT1 expression in control and RetΔGlut1 retinas. 5 μg retina protein was loaded per well. Blots are representative of N=5. Bars indicate average ± SD of GLUT1 intensity normalized to β-actin for N = 5 mice.
F) Western blot analysis of GLUT3 expression in control and RetΔGlut1 retinas. 5 μg retina protein was loaded per well. Blots are representative of N=3. Bars indicate average ± SD of GLUT3 intensity normalized to Vinculin for N = 3 mice.

