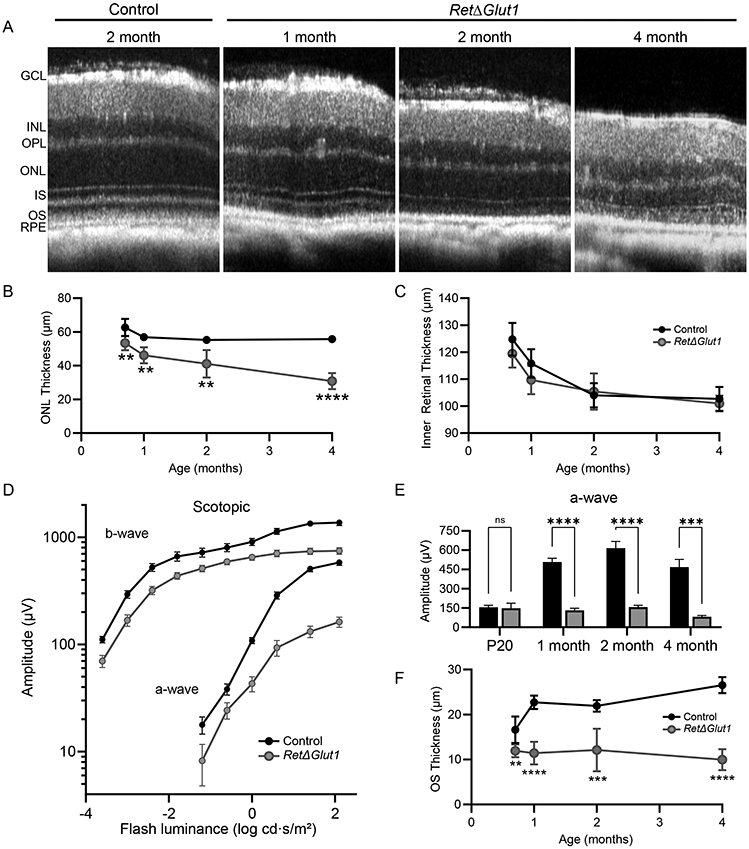
FIGURE 3. Rods degenerate in mice lacking retinal GLUT1 expression.

A) Averaged SD-OCT B-scan from the horizontal meridian of retinas from 2-month-old control and 1, 2, and 4-month-old RetΔGlut1 mice. GCL, INL, OPL, ONL, IS, OS and RPE are indicated.
B) ONL layer thickness measured from volumetric SD-OCT scans at P20, 1 month, 2 months, and 4 months of age. Data points indicate average (± SD) for 3-6 mice.
C) Inner Retinal Thickness (OPL-GCL) measured from volumetric SD-OCT scans at P20, 1 month, 2 months, and 4 months of age. Data points indicate average (± SD) for 3-6 mice.
D) Luminance-response functions for a-waves and b-waves recorded from 1-month mice. Data points indicate average (± SEM) for 13-14 mice.
E) Maximum amplitudes for a-waves (at 1.4 log cd · s/m2 luminance) at the ages indicated. Bars indicate average (± SEM) for 8-14 mice.
F) OS length measured from volumetric SD-OCT scans at P20, 1-, 2- and 4-months of age. Data points indicate average (± SD) for 3-6 mice.
