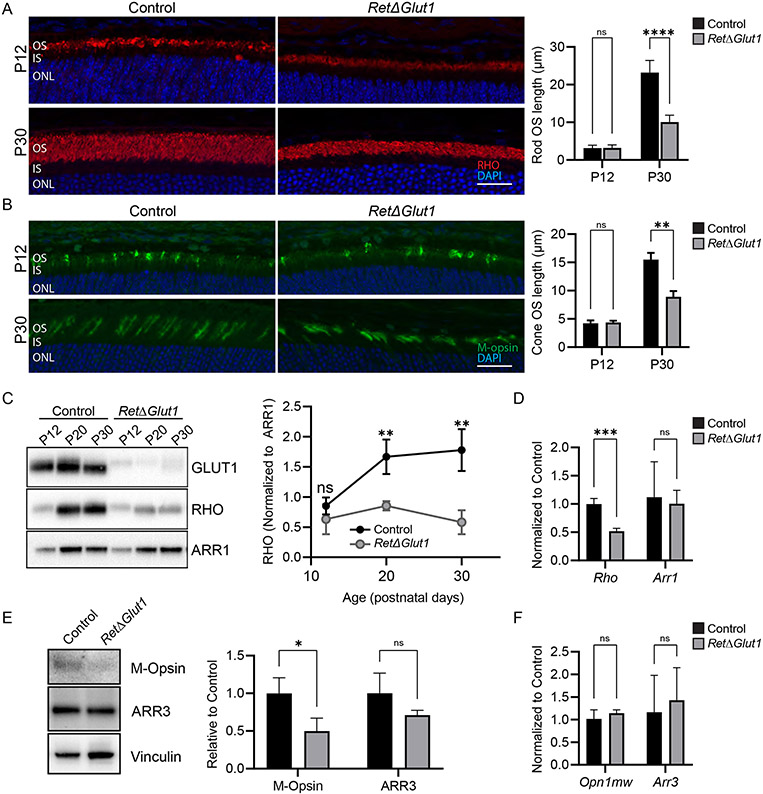
FIGURE 5. Reduced opsin synthesis contributes to the impaired renewal of rod and cone OS.
A) Left: Retina cryosections from control and RetΔGlut1 mice immunolabeled for RHO (red) and counterstained with DAPI (blue) at P12 (top row) and P30 (bottom row). OS lengths were estimated with ImageJ from images of cryosections like those shown from P12 and 1-month control and RetΔGlut1 mice. Right: Bars indicate average ± SD for 3 mice. Scale bar indicates 50 μm.
B) Left: Retina cryosections from control and RetΔGlut1 mice immunolabeled for cone opsin (green) and counterstained with DAPI (blue) at P12 (top row) and P30 (bottom row). OS lengths were estimated with ImageJ from images like those shown at left, from P12 and 1-month control and RetΔGlut1 mice. Right: Bars indicate average ± SD for 3 mice. Scale bar indicates 50 μm.
C) Western blots showing relative GLUT1 (5 μg/well), Rhodopsin (RHO) (0.25 μg/well) and rod arrestin (ARR1) (0.25 μg/well) levels in retina lysates from control and RetΔGlut1 mice aged P12, P20 and P30. The ratio of density signals for rhodopsin relative to ARR1 at various ages was estimated from retinas of control and RetΔGlut1 mice. Data points indicate average ± SD for 3 mice.
D) Relative transcription levels for rhodopsin (Rho) and rod arrestin (Arr1) estimated from real-time RT-PCR analysis with probes for mouse, rho and Arr1 for retinas of P30 control and RetΔGlut1 mice. Bars indicate average ± SD for 3 mice
E) Left: Western blots showing relative M-opsin and cone arrestin (ARR3) levels in retina lysates (2.5 μg/well) from control and RetΔGlut1 mice aged P30. Right: Ratio of density signals for M-opsin and ARR3 relative to vinculin at P30 estimated from retinas of control and RetΔGlut1 mice. Bars indicate average ± SD for 3 mice
F) Relative transcription levels for M-opsin and cone arrestin estimated from real-time RT-PCR analysis with probes for mouse Opn1mw and (Arr3) for retinas of P30 control and RetΔGlut1 mice. Bars indicate average ± SD for 3 mice.

