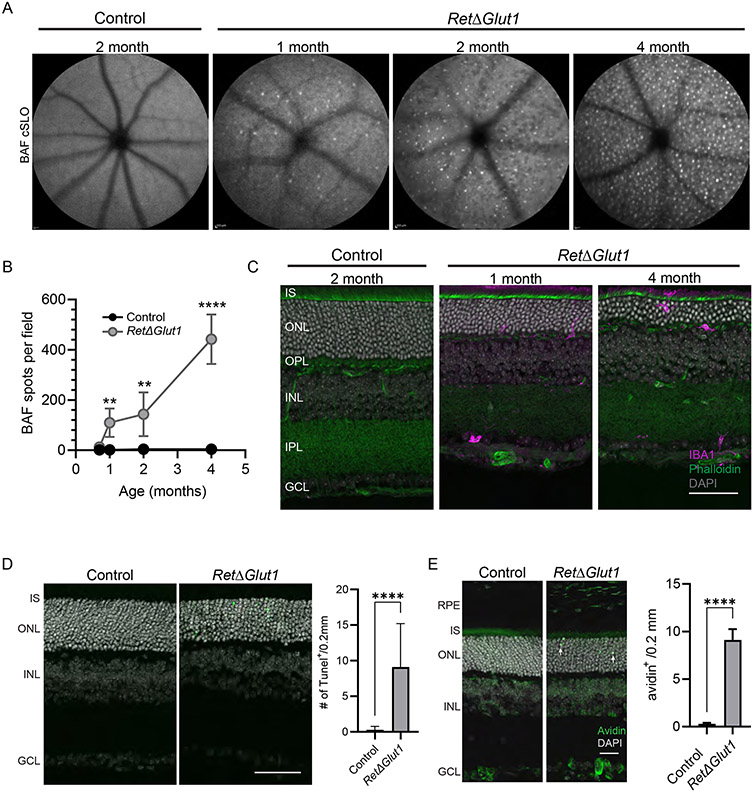
FIGURE 6. Increased inflammation in the outer retina of RetΔGlut1 mice.
A) Representative 55° wide-field BAF-cSLO images obtained from 2-month control and 1-, 2- and 4-month RetΔGlut1 mice.
B) Number of BAF-cSLO identified hyperfluorescent foci were quantified at each age in RetΔGlut1 and control mice. Data points indicate average ± SD for 3-6 mice.
C) Iba-1 immunofluorescence (magenta) in retina cryosections from control, 2 month and 4-month RetΔGlut1 mice counterstained with Phalloidin (green) DAPI (gray). Scale bar indicates 50 μm. IS, inner segments; ONL, outer nuclear layer; OPL, outer plexiform layer, INL, inner nuclear layer; IPL, inner plexiform layer, GCL, ganglion cell layer
D) Left: TUNEL labeling (green) of retina cryosections from P15 control and RetΔGlut1 mice, counterstained with DAPI (gray). Scale bar indicates 50 μm. Right: quantification of TUNEL per 0.2 mm length retina from immunofluorescent images. Bars indicate average ± SD for 2 mice.
E) Left: Avidin labeling (green) of retina cryosections from control and RetΔGlut1 at P15 with DAPI counterstain (gray). Scale bar indicates 25 μm. Right: Quantification of avidin positive cells in oriented fluorescence images within 0.2 mm wide field of view. Bars indicate average ± SD for 3 mice. RPE, retinal pigmented epithelium; IS, inner segments; ONL, outer nuclear layer; INL, inner nuclear layer; GCL, ganglion cell layer.

