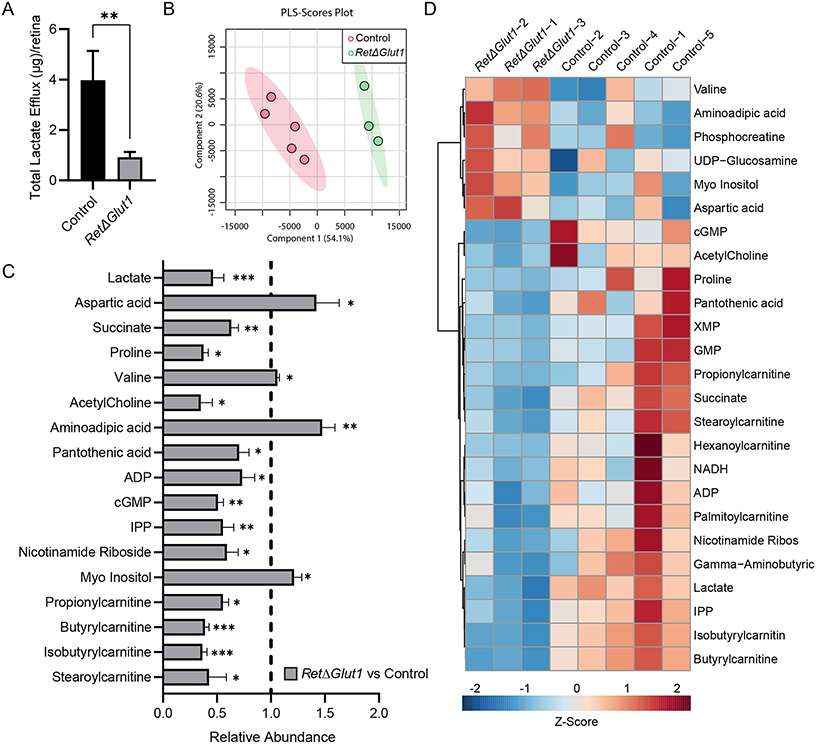
FIGURE 7. RetΔGlut1 mice have reduced lactate efflux and an altered metabolic profile.
A) Lactate efflux from isolated retinas incubated for 1 one hour in Ringer’s with 5mM glucose from control and RetΔGlut1 mice. Bars indicate average ± SEM for 4 retinas.
B) Partial Least-Squares Discriminant Analysis (PLS-DA) of Control and RetΔGlut1 samples from LC-MS data. Data points indicate results from 5 control and 3 RetΔGlut1.
C) Metabolomics analysis of significant metabolites changed in RetΔGlut1 retina samples. Raw data were normalized to the control average (hashed line), and statistical significance was obtained from T-tests after Pareto scaling. Bars indicate average (± SD) for 3-5 mice
D) Heat map of top 25 metabolites changed based on statistical significance or fold change between control and RetΔGlut1 retina samples, after Pareto scaling.

