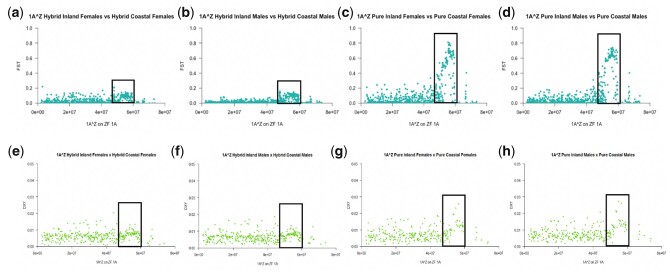
Fig. 3.
Differentiation and divergence between mitolineages for 1AZ markers. Plots show FST values for a) females in the hybrid zone, b) males in the hybrid zone, c) females in pure populations, and d) males in pure populations; and DXY values for e) females in the hybrid zone, f) males in the hybrid zone, g) females in pure populations; and h) males in pure populations. The x-axis shows marker position as mapped to Zebra Finch chromosome 1A. The markers in the black outlined box represent genomic region 1AZ* (51–59 MB).

