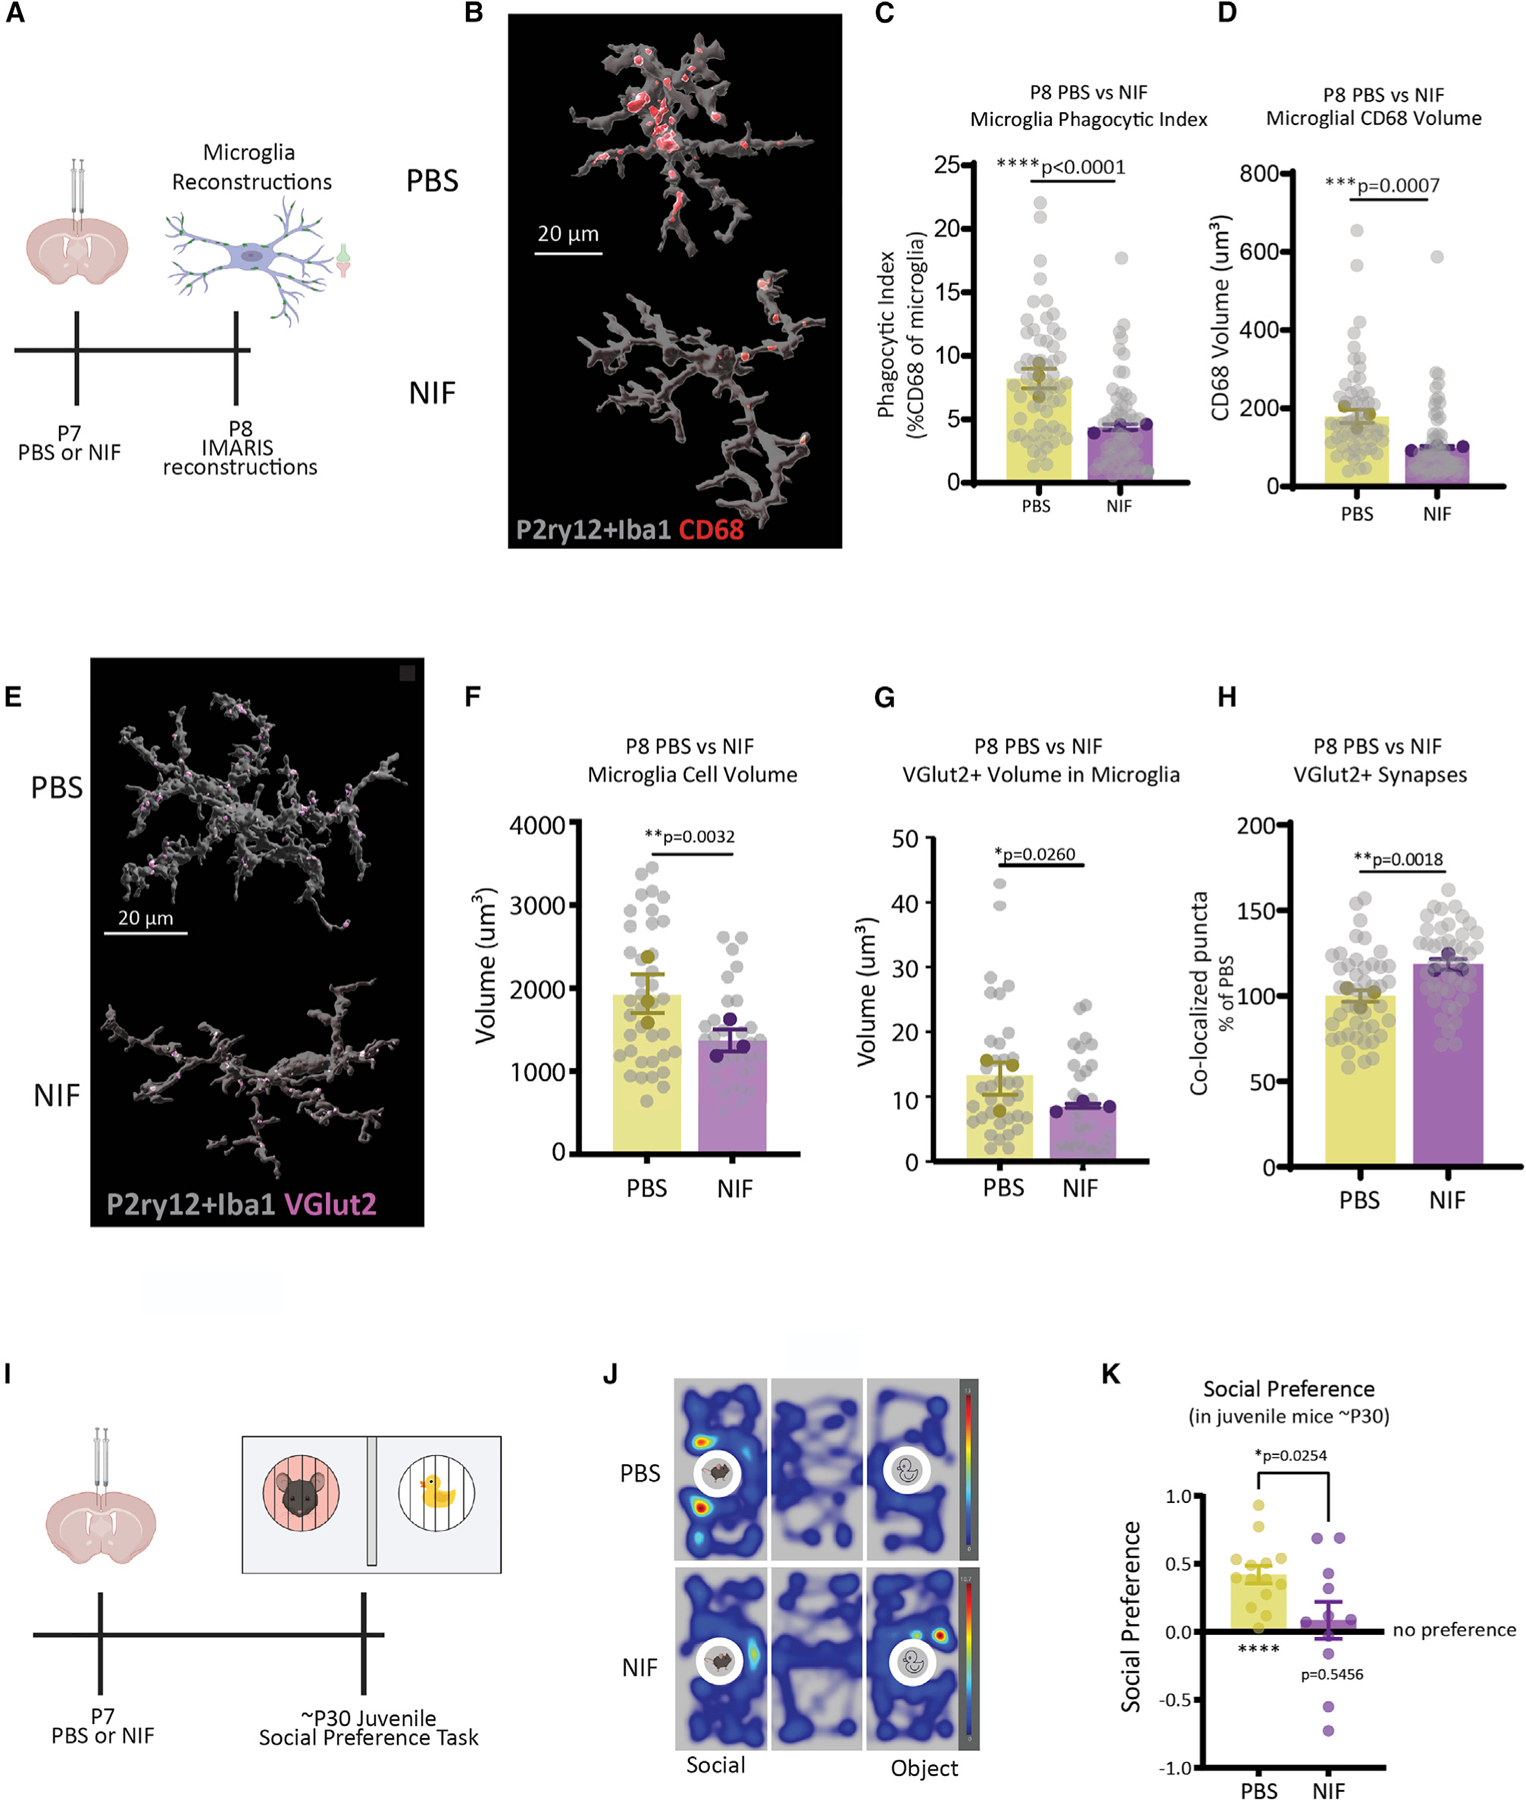
Figure 7. Early postnatal impairment of microglial phagocytic function is sufficient to induce social behavior impairments in male juvenile mice.

(A) PBS or NIF was microinjected into the ACC of P7 WT male mice. Microglial phagocytic content and engulfment were assessed at P8.
(B–D) Representative images and quantification of microglial phagocytic index and CD68 volume in PBS- versus NIF-injected mice (n = 15–20 cells/mouse/condition, n = 3 mice/condition, total of 114 cells analyzed, nested t test).
(E–G) Representative images and quantification of microglial volume and internalized VGlut2 in PBS- versus NIF-injected mice (n = 10–15 cells/mouse/condition, n = 3 mice/condition, total of 72 cells analyzed, nested t test).
(H) Quantification of VGlut2+ synapses in PBS versus NIF mice (n = 3 mice/condition, n = 3 replicates/mouse, 270 images analyzed, nested t test).
(I) PBS or NIF was microinjected into the ACC of P7 mice, then mice were tested in a social preference task at ~ P30.
(J) Representative heatmap of PBS versus NIF juvenile mouse exploration of social versus object.
(K) Quantification of social (n = 11–14 mice/condition, one-sample t test, unpaired t test). Means ± SEM.
