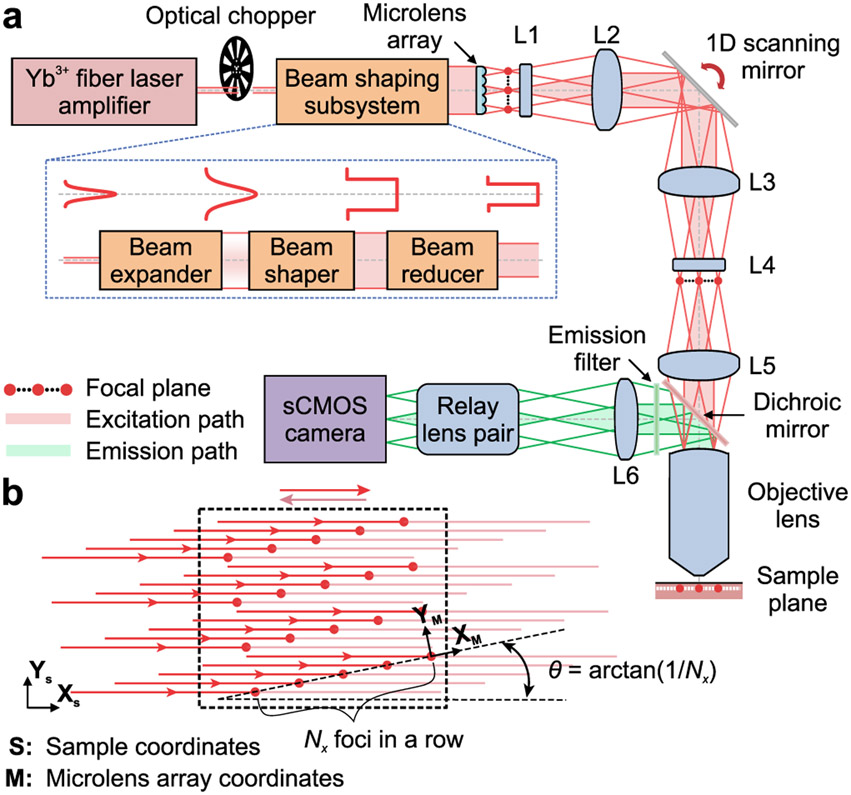
Figure 1 ∣. Microscope design.
(a) A laser amplifier beam (1030 nm; ~280 fs pulse duration) passes through a chopper synchronized to the triangle-wave laser-scanning pattern (Supplementary Figs. 1,2) and is given uniform intensity across a microlens array (lenslet spacing: 100 μm), which creates Nx × Ny beamlets of equal intensity. Nx·Ny is the number of lines scanned in the specimen. Compound (L1 and L4) and aspherical lenses (L2, L3 and L5) establish intermediate and specimen focal planes (red dots: beamlet foci) as Fourier-conjugates to the plane of the scanning mirror. Fluorescence returns through the objective lens, reflects off a dichroic mirror, and is focused by a tube lens (L6) and a relay lens pair onto a sCMOS camera synchronized to the scanning mirror. Excitation and emission pathways for 3 example foci are shown in red and green, respectively. Inset: Bottom, The beam-shaper comprises an expander, a flattop shaper, and a reducer. Top, Beam intensity profiles at each stage.
(b) To scan images at rates ≤1 kHz, the Nx × Ny beamlet array is projected onto the specimen at an angle, θ = tan−1(1/Nx), between the (XS, YS) camera-frame coordinate system (dashed rectangle) and the (XM, YM) microlens array coordinate system. We generally used ≤20 × 20 laser foci (15 μm spacing between beams) oriented 2.9° to the scanning direction, yielding 0.75 μm between scanned lines. We cropped the illumination to match the area projected onto the camera.

