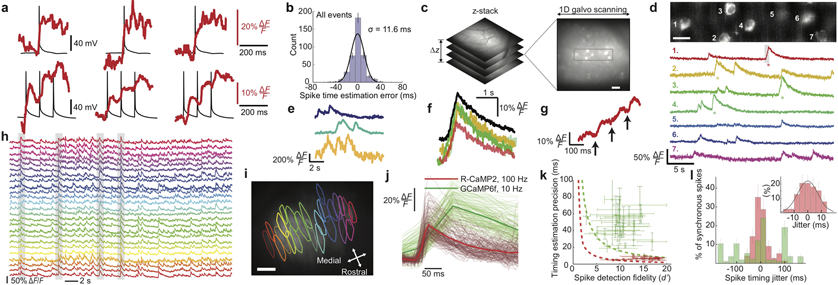
Figure 3 ∣. High-speed Ca2+-imaging in neocortical and Purkinje neurons of awake mice.
(a) To assess the spike-timing accuracy of 1-kHz-two-photon Ca2+-imaging, we monitored neocortical pyramidal cells in live tissue slices via whole-cell electrical recordings (black traces) and concurrent Ca2+-imaging (red traces; 100 kHz laser pulse rate; 0.7 mW per beamlet) using the Ca2+-indicator Calbryte-590. Using one or more electrical pulses (each 2 ms and 0.5–1.7 nA), we evoked individual or ≤5 successive spikes, eliciting Ca2+ transients. Examples of single, Top, or bursts of 3 spikes, Bottom. Stepwise increments in Ca2+ signals often accompanied individual spikes in a burst.
(b) We estimated occurrence times of spikes and spike bursts via matched filtering of the Ca2+ transient waveforms, compared these to the actual times recorded electrically, and made a histogram of timing errors, aggregated across spikes and spike bursts. RMS timing error: 11.6 ms.
(c) In awake mice expressing GCaMP6f in layer 2/3 cortical pyramidal cells, we first sampled a tissue volume to identify a plane suitable for 1-kHz-Ca2+-imaging. Boxed area (48 × 192 μm2) is magnified in d.
(d) Top, We recorded the concurrent Ca2+ dynamics of 7 layer 2/3 neurons in an awake mouse (1-kHz-imaging; 50 kHz laser pulse rate; ~0.36 mW per beamlet). We bandpass-filtered the image with a difference of Gaussians (cutoffs: 0.42 μm and 12 μm). Scale bar: 20 μm. Bottom, Activity traces of individual cells, shown down-sampled to 500 Hz and median-filtered (time-constant: 16 ms). Asterisks mark individual Ca2+ transients shown in color-corresponding traces in f, g.
(e) Ca2+ activity traces of layer 2/3 neurons in an awake mouse, acquired by 100-Hz-Ca2+-imaging 296 μm beneath the cortical surface (100 kHz pulse rate; 2.15 mW per beamlet). Traces were median-filtered (time constant: 200 ms).
(f) Individual (colored traces) and mean (black trace) waveforms of 4 Ca2+ transients with asterisks in d, aligned within 4.2 ± 2.4 ms (mean ± s.d; N = 4 transients) to the onset of excitation.
(g) Gray-shaded portion of the marked Ca2+ transient in cell 1 in d reveals a staircase-like waveform in the transient’s rising phase, similar to those seen in vitro, a, suggesting the Ca2+ transient accompanied a burst of spikes.
(h, i) We used 100-Hz-Ca2+-imaging (200 kHz laser pulse rate; 2.9 mW per beamlet) to observe dendritic Ca2+-spiking activity of cerebellar Purkinje neurons expressing R-CaMP2 in awake mice. Example ΔF/F traces, h, of 25 neurons whose contours are shown in i superposed on a mean (0.5-min-average) two-photon image. Gray shading in h marks 4 example events when ≥80% of the visible neurons spiked synchronously. Scale bar in i: 50 μm. Field of view: 450 × 300 μm2.
(j) Waveforms of 492 individual Ca2+ spikes, after alignment of baseline fluorescence levels and spike occurrence times. Red traces: 177 randomly chosen spikes from 23 neurons imaged as in h. Green traces: 315 randomly chosen spikes from 43 Purkinje neurons imaged using GCaMP6f and conventional two-photon microscopy (10-Hz-imaging; 920 nm illumination; 30 mW).
(k). By fitting a parameterized waveform to each trace in j, we found that the mean s.d. rise time to half-maximum amplitude was 13 ± 5 ms for 177 R-CaMP2 spikes imaged at 100 Hz and 50 ± 15 ms for 315 GCaMP6f spikes imaged at 10 Hz. To quantify the spike-timing estimation accuracy, we used the 95% C.I. for the model parameter setting the spike occurrence time, yielding timing accuracies of 6.8 ± 3.4 ms (mean ± s.d; 177 R-CaMP2 spikes; 100-Hz-imaging) and 48 ± 30 ms (315 GCaMP6f spikes; 10-Hz-imaging). For each Purkinje neuron, we also determined d’, the spike detection fidelity13. We plotted for each cell the spike-timing accuracy versus d’ (red data points for cells studied by 100-Hz-imaging; green points for cells studied by conventional two-photon imaging). Dashed curves denote theoretical limits on spike-timing accuracy for 100-Hz-imaging (red curve) and 10-Hz-imaging on the conventional two-photon microscope (green curve), based on the Chapman-Robbins lower bound on the variance of an unbiased estimator13 and by approximating the 95% C.I. as twice the s.d. To calculate these limits, we used a 150 ms decay time-constant for both Ca2+-indicators and values from j of 30% ΔF/F for R-CaMP2 and 50% ΔF/F for GCaMP6f. Horizontal error bars: s.e.m. of each cell’s d’ value across all its spikes. Vertical error bars: s.e.m. of the 95% C.I. values across all spike occurrence times for each cell. High-speed Ca2+-imaging allows higher d’ values and timing accuracies within several milliseconds of the physical limitations.
(l) Histogram of empirically determined timing jitters for individual spikes in synchronous spiking events, defined as instances when ≥80% of the visible Purkinje neurons spiked concurrently. We visually identified candidate events and used the methods of j to estimate spike occurrence times. We determined each spike’s jitter as the difference between its occurrence time and the mean time for all spikes in the synchronous event. The mean absolute jitter using 100-Hz-imaging and R-CaMP2 was 7.8 ± 5.5 ms (mean ± s.d.; N = 77 spikes), versus 61 ± 53 ms (N = 116 spikes) with conventional (10 Hz) two-photon imaging and GCaMP6f. Inset: Expanded view of the histogram for synchronous spikes recorded by high-speed imaging. Error bars: s.d. estimated as counting errors.

