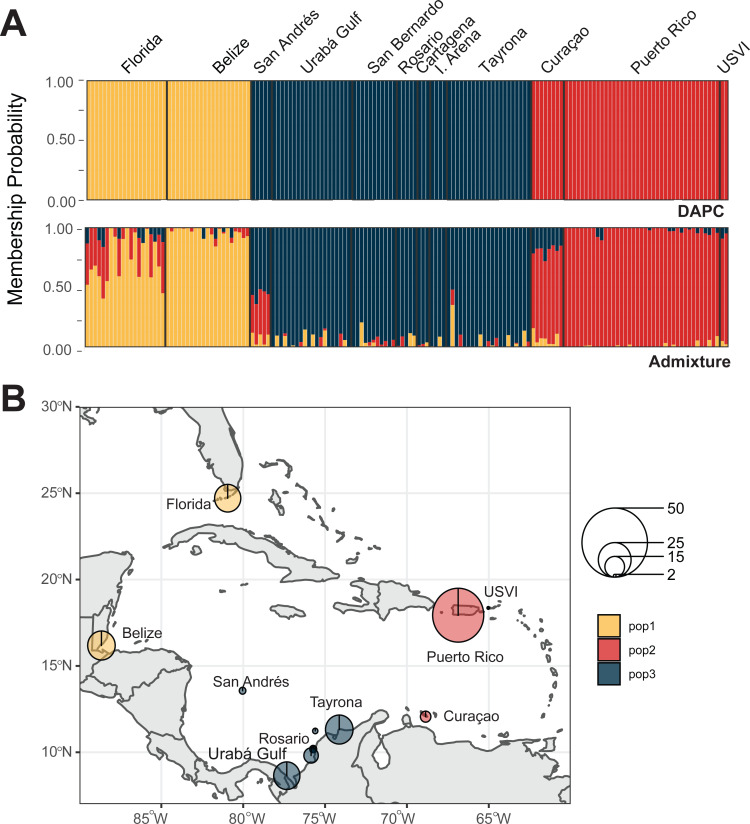
Figure 5. Population assignments for Acropora palmata across the wider Caribbean region.
(A) DAPC, on top, and ADMIXTURE, on bottom, assignments for 159 unique A. palmata MLGs. Columns represent individual samples and their associated probability of assignment to K = 3 color-coded genetic clusters (pop1 = yellow, pop2 = red, pop3 = blue). Additional Ks are presented in Supplemental Figs. S8 and S9. (B) Pie charts of the population assignments for each collection region based on the DAPC results above. Circle sizes are proportional to the number of samples analyzed.

