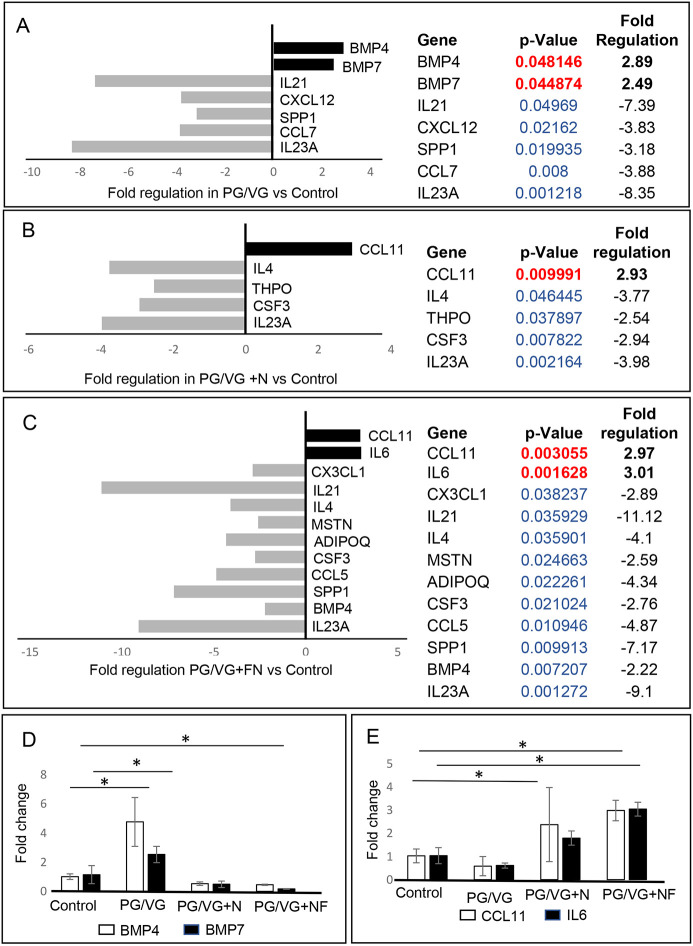
Fig. 2.
RT2 PCR profiling analysis focusing on human cytokine and chemokine expression. (A-C) Significantly differentially expressed genes involved in mucosal inflammation in PG/VG versus control (A), PG/VG and nicotine versus control (B) and PG/VG and flavor and nicotine versus control (C). Upregulated genes with positive fold-regulation values are highlighted in black. Downregulated genes with negative fold-regulation values are highlighted in gray. Fold-change regulations and statistical analyses were calculated using the web portal at http://www.qiagen.com/geneglobe and are presented as column graphs without error bars (error bar calculations were not included in the final reports). The fold-change threshold was set to 2. P-values were calculated based on a two-tailed unpaired Student's t-test of the replicate 2−ΔΔCT values for each gene in the control and treatment groups and P<0.05 was considered as significant. P-value calculation used was based on parametric, unpaired, two-sample equal variance and two-tailed distribution. Samples were run in triplicate (n=3, 12 samples total). (D,E) Overlap in expression levels of BMP4 and BMP7 (D) and CCL11 and IL6 (E) in control and experimental groups. The CT values were manually pulled from the datasets and fold-change regulation was calculated using 2−ΔΔCT. Error bars represent the mean±s.e.m. from three biological replicates (n=3). One-way ANOVA with Tukey’s HSD test were used to confirm statistical significance in gene expression; *P≤0.05.

