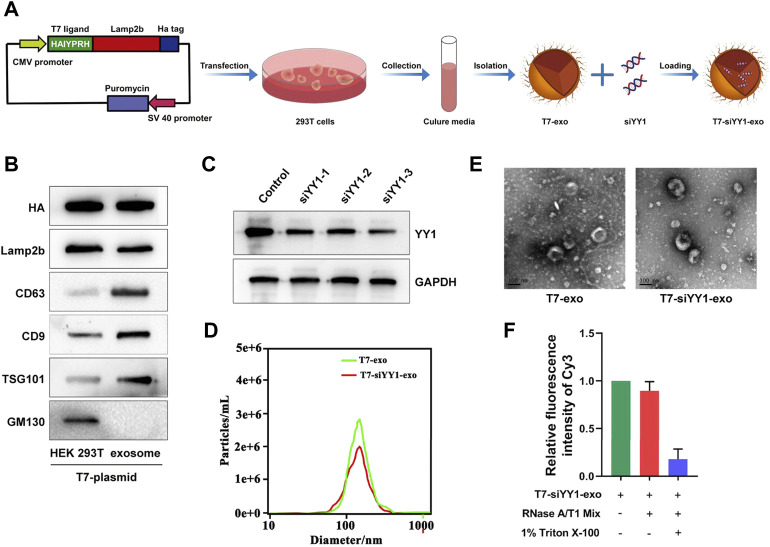
FIGURE 1.
Preparation and characterization of T7-siYY1-exo. (A) Schematic diagram of preparation and isolation of T7-siYY1-exo. (B) Detection of CD9, CD63, TSG101, Lamp2b, HA, and GM130 expression by Western blot. (C) Detection of YY1 knockdown efficiency. (D) Size distribution of T7-exo and T7-siYY1-exo measured by NANO SIGHT. (E)Transmission electron micrograph of T7-exo and T7-siYY1-exo. (F) qRT-PCR analysis of siYY1-Cy3 after treatments with RNase A/T1 Mix and 1% Triton X-100 for 30 min.

