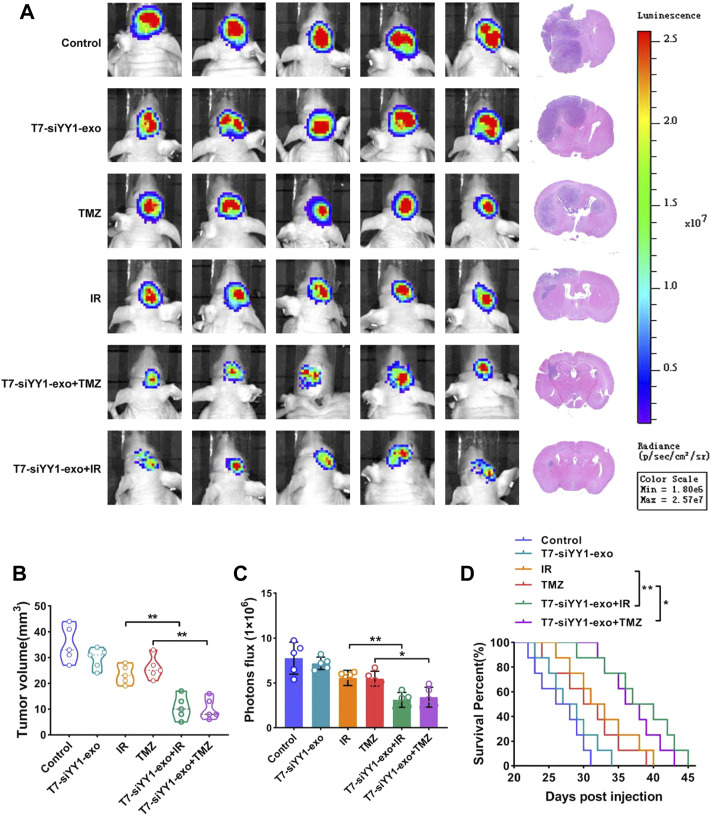
FIGURE 6.
Anti-tumor efficiency of T7-siYY1-exo in vivo. (A) Left, representative images of in vivo orthotopic GBM bioluminescence. Right, Representative images of H&E staining. Bioluminescence images were captured by IVIS on day 21 in all groups. After mice sacrifice, brain tissue samples were obtained for HE staining. (B) The tumor volume was calculated using a modified ellipsoid formula. Brain tissue samples were obtained after mice sacrifice. p values are displayed as *p ≤ 0.05, **p ≤ 0.01, ***p ≤ 0.001. (C) Quantification of the bioluminescence of xenografts derived from the luciferase-labeled LN229 cells in each group. Bioluminescence images were captured by IVIS on day 21 in all groups. p values are displayed as *p ≤ 0.05, **p ≤ 0.01, ***p ≤ 0.001. (D) Kaplan–Meier survival plot was graphed to evaluate mice lifespan in each group, mice were collected at end stage. p values are displayed as *p ≤ 0.05, **p ≤ 0.01, ***p ≤ 0.001.

