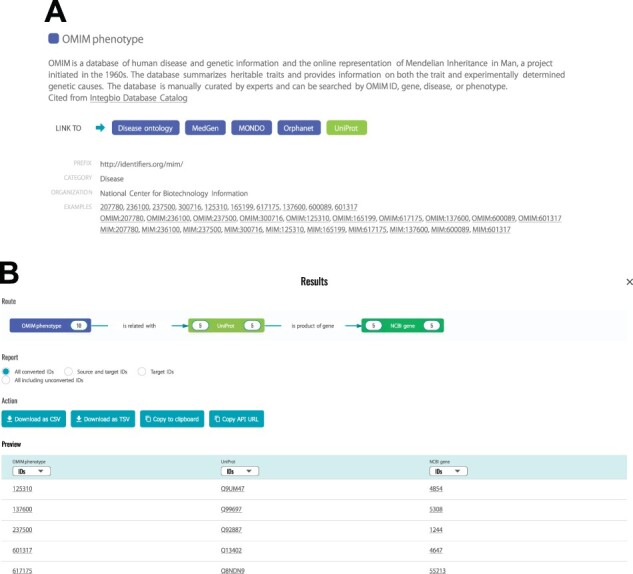
Fig. 2.

Browsing available datasets and conversion results. (A) In the ‘DATASETS’ tab, users can browse the list of datasets. Each dataset has a description imported from the Integbio Database Catalog, a list of directly linked datasets and a list of IDs to exemplify acceptable ID formats, which can be used to test the conversion by clicking. (B) In the ‘Results’ window, the ‘Route’ displays the number of corresponding IDs along with the biological meanings. In the ‘Report’ section, users can specify the format of the results, which can be retrieved from the ‘Action’ buttons. The IDs in the ‘Preview’ table are linked to the original DB entry. In this example, users can find that OMIM phenotype ID: 601317 (Deafness) is related to UniProt ID: Q13402 (Unconventional myosin-7a) and that this protein is corresponding to NCBI Gene ID: 4647 (MYO7A)
