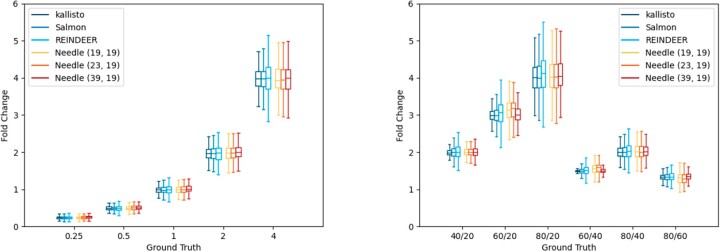
Fig. 5.
Left shows the differential expression comparison and right the coverage comparison of Needle, kallisto, Salmon and REINDEER for k = 19 on the simulated dataset. Needle represents Needle based on -minimizers. The values on the x-axis in the left figure represent the ground truth, the expected fold change between differential expressed genes, while the y-axis presents the actual measured fold change. The values on the x-axis in the right figure represent the ground truth, the actual fold change between coverages, for example 40/20 stands for coverage 40 divided by coverage 20, while the y-axis presents the actual observed fold change between coverages

