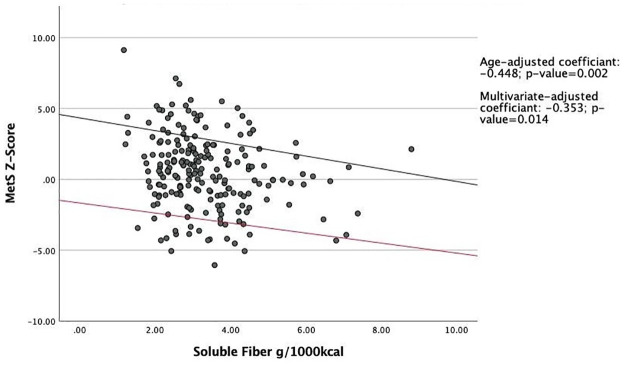
Fig 2. Association between soluble fiber intake and MetS Z-score.
Abbreviations: MetS, Metabolic Syndrome. Linear regression model was used to predict association between soluble fiber intake and MetS z-score. The black regression line indicates age-adjusted linear regression, for which the coefficient is -0.448. The red line indicates multivariate-adjusted regression, for which the coefficient is -0.353. Means were adjusted for age, BMI, smoking, education, marital status, total physical activity, and total energy intake. Both lines are statistically significant.

