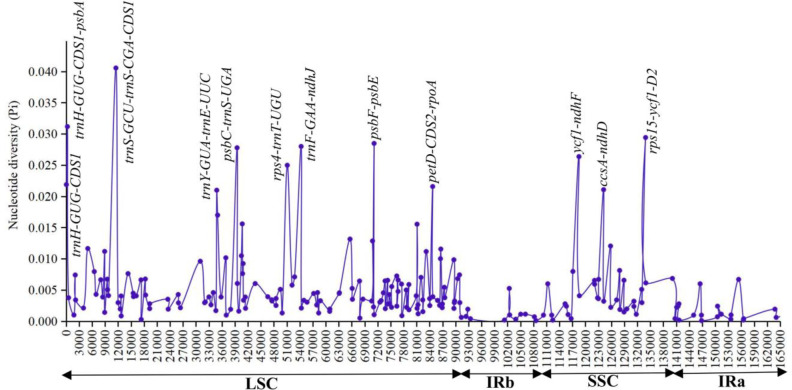
Fig 7. Plot of sliding window analysis of the whole chloroplast genomes for nucleotide diversity (Pi) compared among seven chloroplast genomes of Aglaonema.
Peak regions with a Pi value of > 0.021 were labeled with loci tags of names. x-axis shows the position of the midpoint of each window. y-axis shows Pi values of nucleotide diversity in a a sliding window analysis with window length 800 bp and step size 200 bp.

