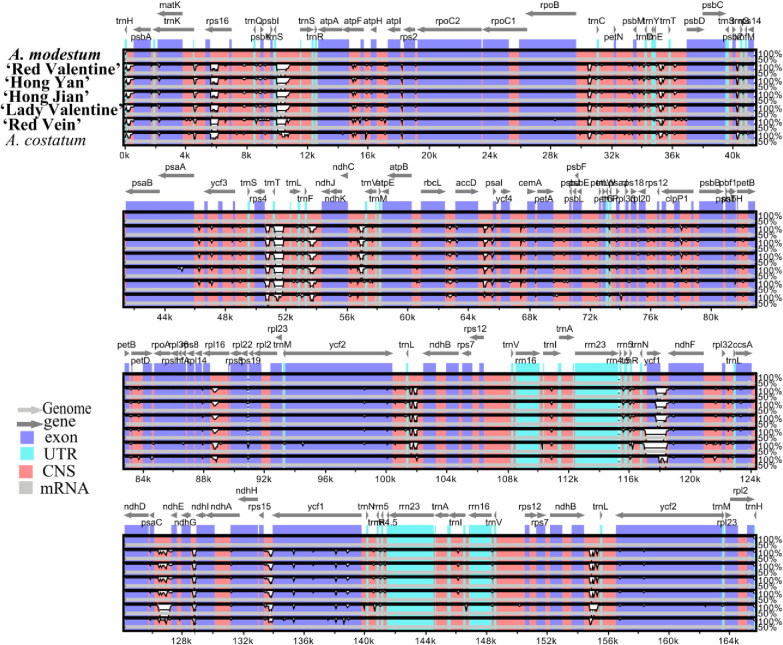
Fig 8. Complete chloroplast genome comparison of seven Aglaonema chloroplast genomes using A. modestum as a reference.
Gray arrows and thick black lines above the alignment indicate gene orientation. Purple bars represent exons, sky-blue bars represent untranslated regions (UTRs), red bars represent non-coding sequences (CNS), gray bars represent mRNA and white regions represent sequence differences among analyzed chloroplast genomes. The y-axis represents the identity percentage ranging from 50% to 100%. The six sequenced Aglaonema chloroplast genomes here are in bold.

